We Analyzed 40,000 MCA Merchants. Here’s How to Think About Targeting Stackers.
14.8% of MCA merchants currently have two or more active advances. But the rate varies wildly by industry, state, and timing. Here’s the full breakdown.
If you’re an MCA broker, you already know stacking exists. What you probably don’t know is how common it actually is — or which industries and states over-index on it.
We classified every UCC filing in our database by collateral type and computed the active advance count for each business. The result: a stacking map across 40,447 MCA merchants in Florida, California, Colorado, and New York.
The short version: nearly 6,000 businesses are carrying two or more active MCA positions right now. That’s 14.8% of all MCA merchants in our dataset. And the distribution isn’t random.
The Stacking Pyramid
Most MCA merchants carry a single active advance. But the tail is thicker than you’d expect.
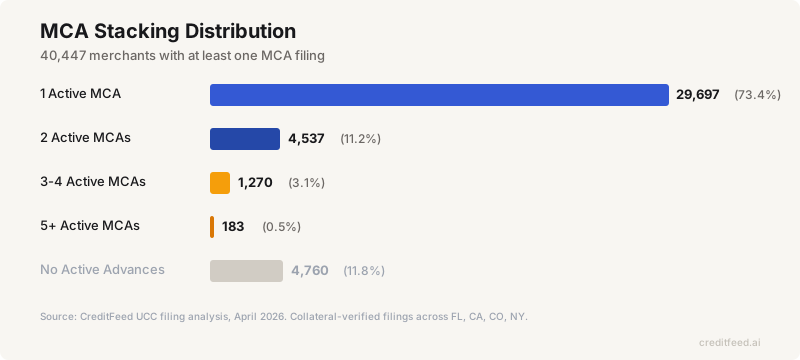
| Stacking Depth | Merchants | Share |
|---|---|---|
| 1 active advance | 29,697 | 73.4% |
| 2 active advances | 4,537 | 11.2% |
| 3–4 active advances | 1,270 | 3.1% |
| 5+ active advances | 183 | 0.5% |
| No active advances | 4,760 | 11.8% |
Nearly 1 in 7 MCA merchants is already stacked. If you’re submitting deals to funders, knowing whether a prospect has one position or three changes everything — the funder’s appetite, the offer terms, and your commission structure.
Which Industries Stack the Most?
This is where it gets interesting. Stacking rates vary by almost 60% between the highest and lowest industry verticals.
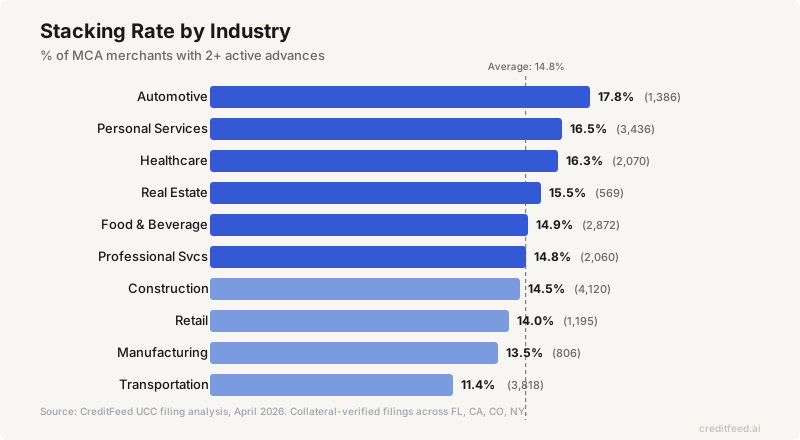
| Industry | MCA Merchants | Stacking Rate | Heavy (3+) |
|---|---|---|---|
| Automotive | 1,386 | 17.8% | 4.8% |
| Personal Services | 3,436 | 16.5% | 4.1% |
| Healthcare | 2,070 | 16.3% | 4.0% |
| Real Estate | 569 | 15.5% | 3.7% |
| Food & Beverage | 2,872 | 14.9% | 3.7% |
| Professional Services | 2,060 | 14.8% | 3.7% |
| Construction | 4,120 | 14.5% | 3.0% |
| Retail | 1,195 | 14.0% | 4.1% |
| Manufacturing | 806 | 13.5% | 3.0% |
| Transportation | 3,818 | 11.4% | 2.0% |
The surprise: Automotive leads, not Construction
Auto shops, tire shops, body shops, and car washes stack at 17.8% — the highest of any broad industry. The sub-verticals tell the story: tire shops stack at 29.2%, body shops at 20.7%, car washes at 18.4%. These are capital-intensive businesses with seasonal cash flow swings and high equipment costs. When one advance doesn’t cover the gap, they take a second.
The bigger surprise: Transportation is the least stacked
Trucking and logistics companies are the second-largest MCA vertical by volume (3,818 merchants). But their stacking rate is just 11.4% — the lowest of any major industry. Why? Many trucking companies use invoice factoring with exclusive receivables liens, which structurally prevents stacking. The per-unit economics are also large enough that funders fight hard to retain these clients in single-lender relationships.
Healthcare stacks quietly
Healthcare and dental practices stack at 16.3%, with 4.0% carrying three or more active positions. These businesses have predictable revenue (insurance reimbursements) but often face cash flow timing gaps. They’re sophisticated enough to manage multiple positions and creditworthy enough that lenders compete for them.
Case Study: Florida Stacks at 2x the Rate
Stacking rates vary by geography — and Florida is an outlier. With 16,836 MCA merchants, Florida’s stacking rate hits 21.0%, compared to just 10.4% across the rest of our dataset. That’s more than double.
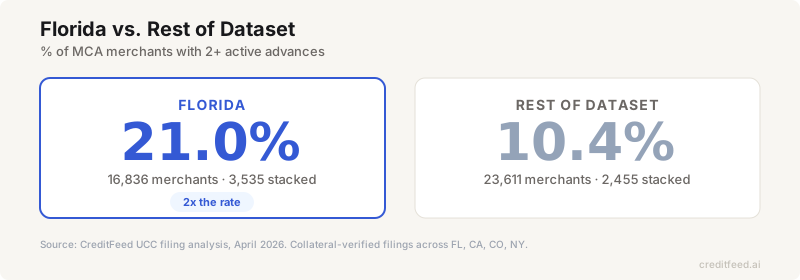
This likely reflects Florida’s longer history as an MCA market. The broker infrastructure is deep, lender relationships are established, and businesses appear to have normalized carrying multiple positions. It’s a useful benchmark for what more mature MCA markets may look like.
For brokers working Florida leads: assume the prospect has been touched. The question isn’t whether they have an advance — it’s how many and from whom.
Stacking Peaks at 6–12 Months
How does stacking behavior change based on when a merchant last took an advance?
| Last MCA Filing | Merchants | Stacking Rate |
|---|---|---|
| Last 6 months | 7,441 | 18.2% |
| 6–12 months ago | 4,734 | 20.3% |
| 1–2 years ago | 6,260 | 17.7% |
| 2+ years ago | 22,012 | 11.7% |
Stacking peaks in the 6–12 month window — right when the initial advance is partially paid down but the business still needs capital. This is the sweet spot for renewal and stacking offers. After 12 months, stacking rates start to decline as positions get paid off.
The takeaway: If a merchant took an MCA 6–12 months ago, there’s a 1 in 5 chance they’ve already added a second position. That’s either a competitor who beat you to it, or an opportunity to add a complementary position on top.
Which Lenders’ Merchants Stack the Most?
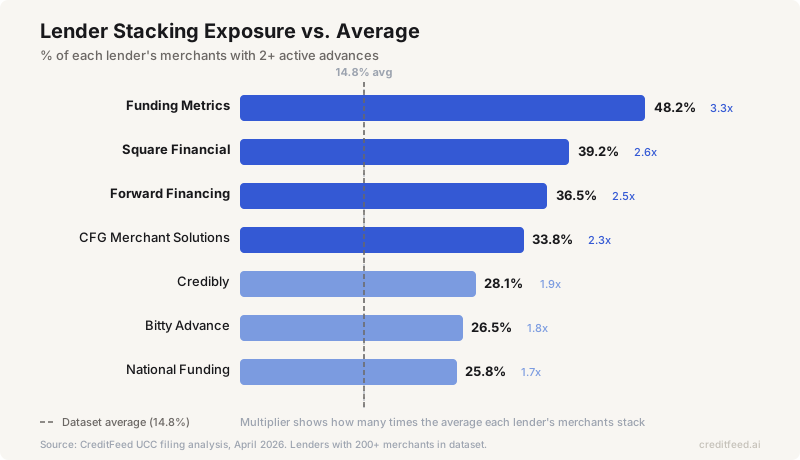
Not all lenders’ portfolios look the same. Some funders’ merchants stack at dramatically higher rates than others — every lender below is at least 1.7x the dataset average of 14.8%.
| Lender | Merchants | % Stacked |
|---|---|---|
| Funding Metrics | 552 | 48.2% |
| Square Financial Services | 347 | 39.2% |
| Forward Financing | 266 | 36.5% |
| CFG Merchant Solutions | 944 | 33.8% |
| Credibly | 463 | 28.1% |
| Bitty Advance | 404 | 26.5% |
| National Funding | 298 | 25.8% |
Nearly half of Funding Metrics’ merchants carry a second active position. Square Financial (the embedded finance arm powering merchant lending) sits at 39%. These aren’t bad numbers for the lenders — stacking is a feature of the market, not a bug. But for brokers, it means different things depending on your deal structure.
If you’re submitting a second-position deal, knowing the first-position lender matters. Some funders are stacking-friendly. Others aren’t. This data tells you who attracts merchants that stack — and by extension, which lenders are accustomed to seeing stacked deals cross their desk.
Putting It Together: How to Target Stackers
The data points to a clear targeting framework. If you’re sourcing stacked deals, stack the filters:
- Start with industry. Automotive (17.8%), Personal Services (16.5%), and Healthcare (16.3%) stack at well above average. Construction gets all the broker attention because it’s the largest MCA vertical — but auto shops are 23% more likely to carry a second position.
- Filter by timing. Merchants who took an MCA 6–12 months ago stack at 20.3% — the highest of any window. If you funded a deal 8 months ago and haven’t checked in, someone else probably has.
- Layer in geography. In mature MCA markets like Florida (21% stacking — 2x the rest of the dataset), assume the prospect has been touched. Lead with “I can see you have an active position — here’s how we complement it” rather than cold-pitching MCA basics.
- Check the first-position lender. If a merchant’s existing funder is Funding Metrics, Square, or Forward Financing, the odds they’re already stacked are 2.5–3.3x the average. Some funders are stacking-friendly. Others aren’t. Knowing who’s in first position changes your pitch and your deal structure.
The brokers who win stacking deals aren’t working harder — they’re filtering smarter. Industry × timing × geography × lender. That’s four dimensions most brokers never combine.
Methodology
This analysis covers 953,518 organizations with collateral-verified UCC filings across Florida, California, Colorado, and New York. We identified 40,447 organizations with at least one future-receivables filing (the collateral type that maps 1:1 to merchant cash advances). Active MCA count is computed by counting distinct secured-party origination filings per organization. Because MCA lenders do not consistently file UCC-3 terminations, our stacking rates likely represent an upper bound.
All data is from CreditFeed’s UCC filing intelligence platform. Updated daily.
Filter MCA merchants by stacking depth, industry, state, lender, and timing.
Instead of guessing which merchants are stacked, see it. Four dimensions. One view.
Start free →