Is MCA Dead? Here's What the Data Tells Us.
The forum version was simple: MCA is not dead. The longer read is more useful: originations are growing, borrower count is expanding, and the market is getting harder because capital is concentrating.
Every few weeks, the MCA market has the same argument.
Is volume down? Are funders pulling back? Are brokers just seeing worse files? Or is the whole thing dead and nobody wants to say it out loud?
The filing data says something more specific: MCA is growing. It is also getting more competitive, more concentrated, and harder to work from the same recycled lead sources. That is why the market can feel worse while the underlying activity keeps moving up.
We pulled MCA origination filings from select markets across California, Florida, Colorado, New York, Connecticut, and Kentucky. The sample is not a national census. It is a directional read across large, diverse filing markets, using UCC originations classified as future-receivables financing.
The direction is hard to miss.
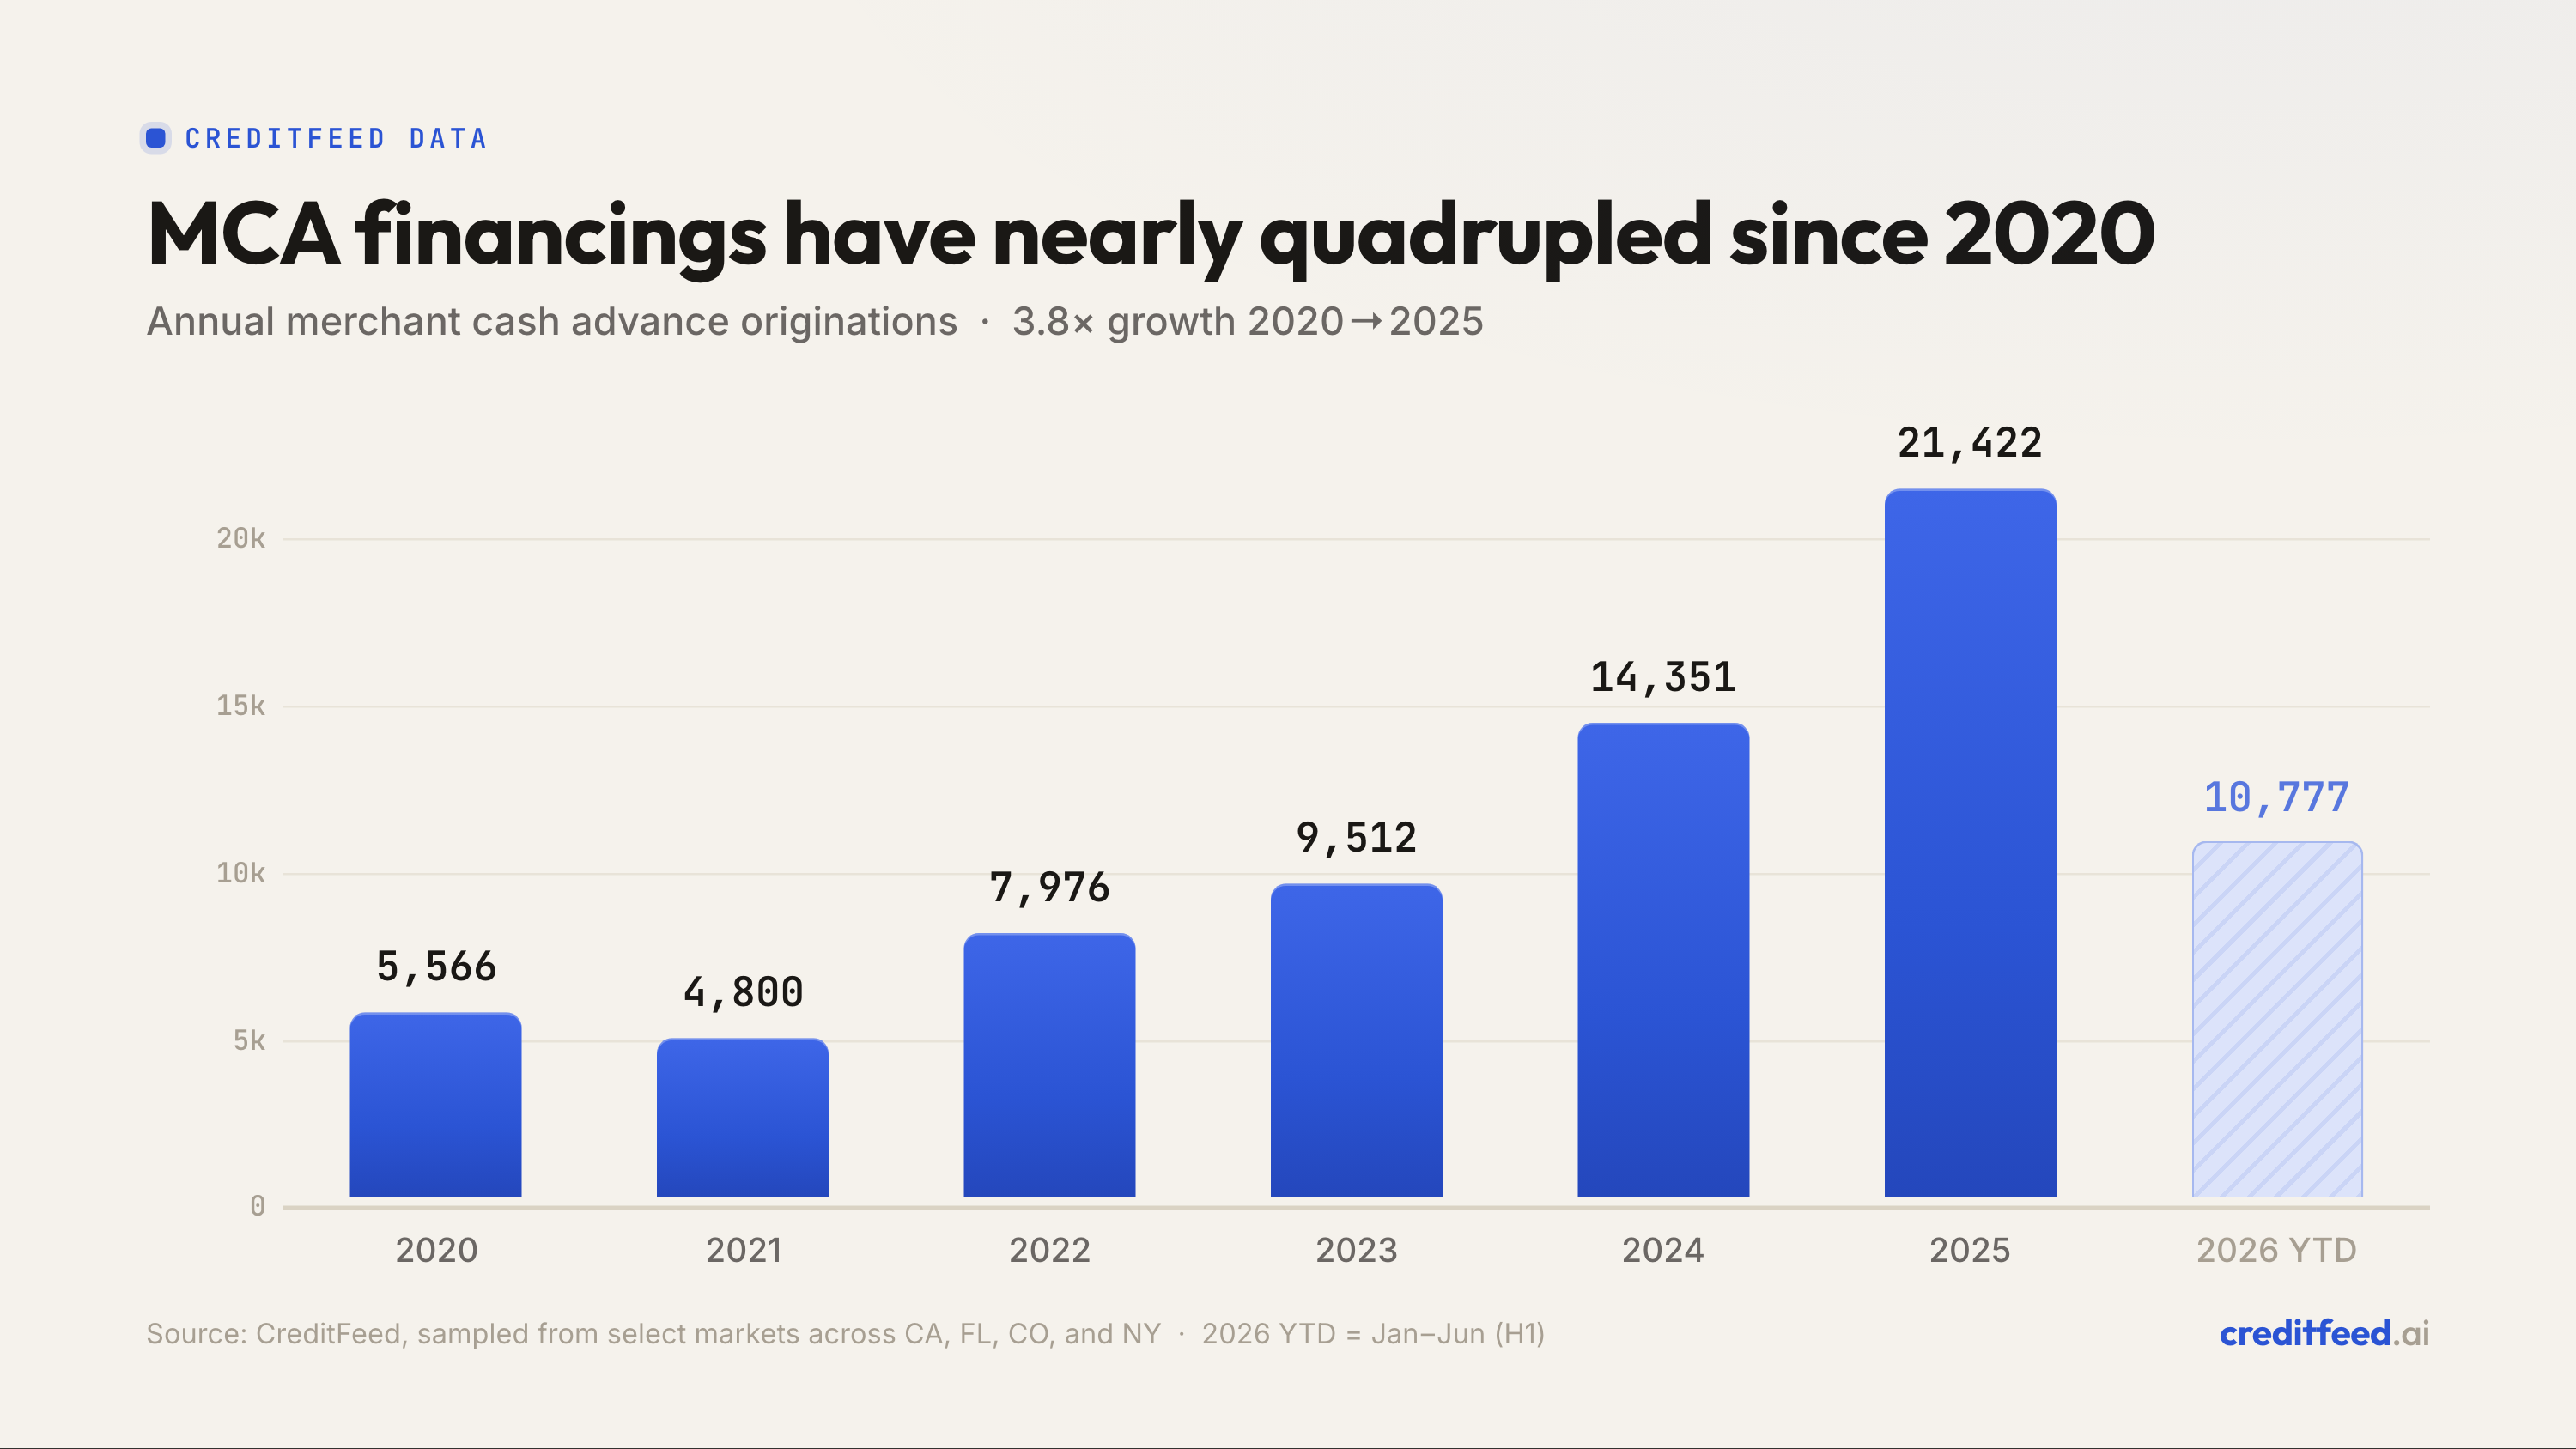
MCA originations are up roughly 3.8x since 2020
Across the sampled markets, annual MCA originations have nearly quadrupled since 2020. The cleanest recent read is 2025, because 2024 includes some improvement in data coverage. Even with that caveat, 2025 still shows strong real growth, not a market rolling over.
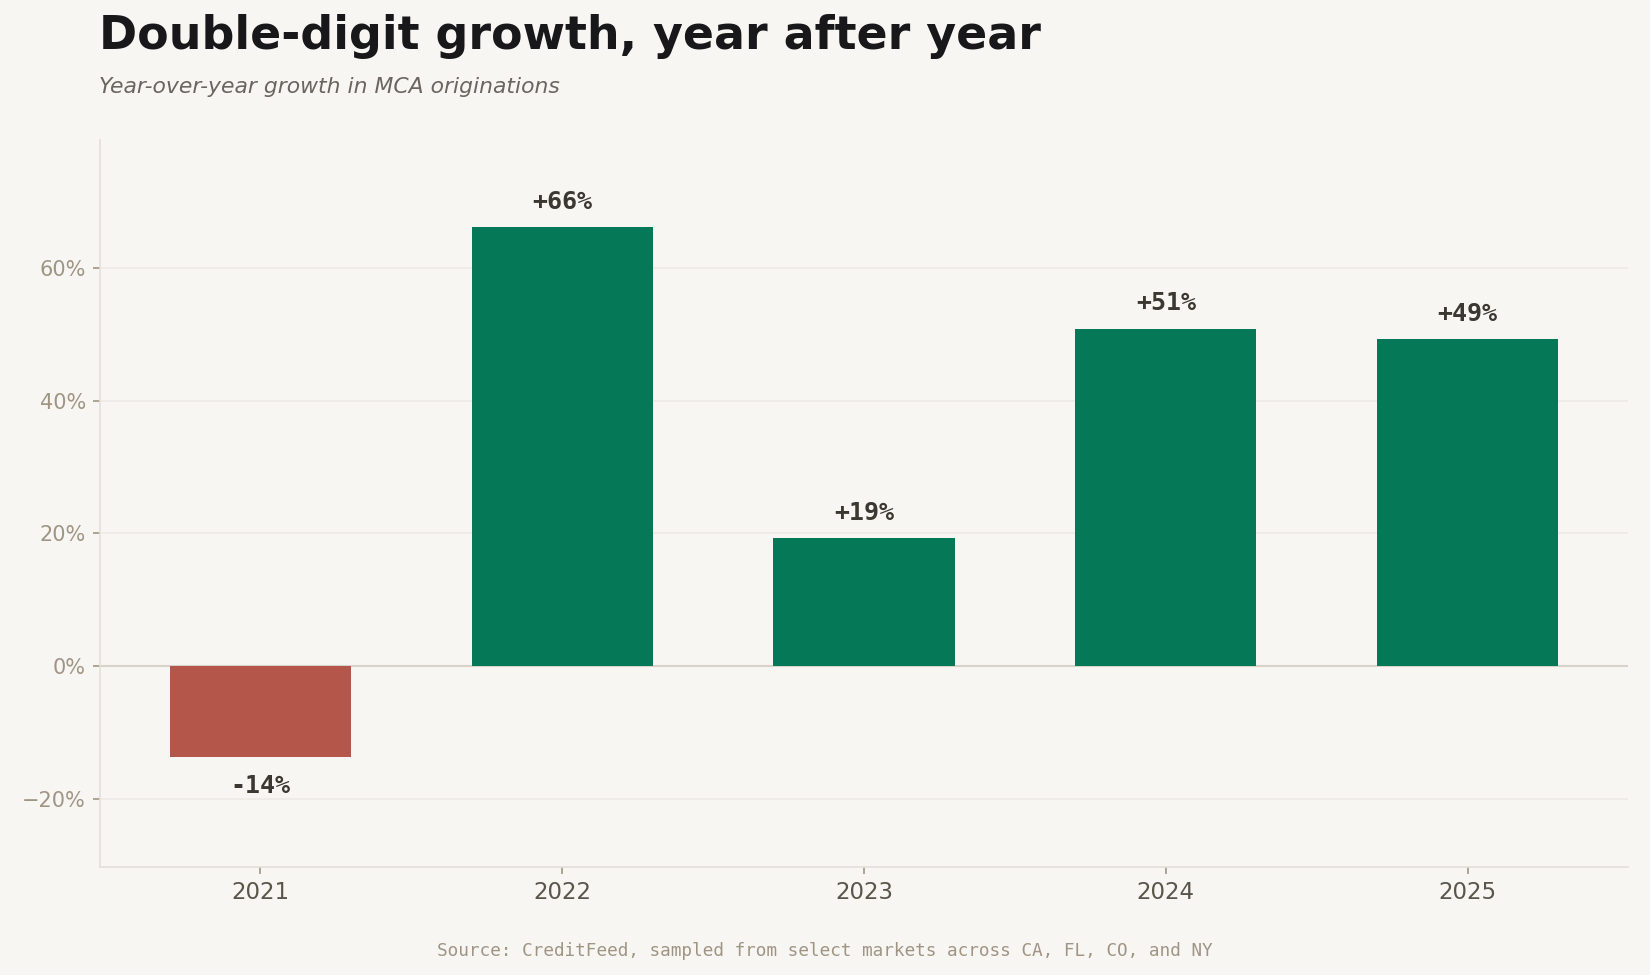
The year-over-year growth rate was roughly +49% in 2024 and +49% again in 2025. That matters because the second +49% came after the coverage improvement. It is the better read on the underlying market.
Quarterly momentum tells the same story. 2026 is not complete, and Q2 has filing lag, but the first half does not look like a collapse.
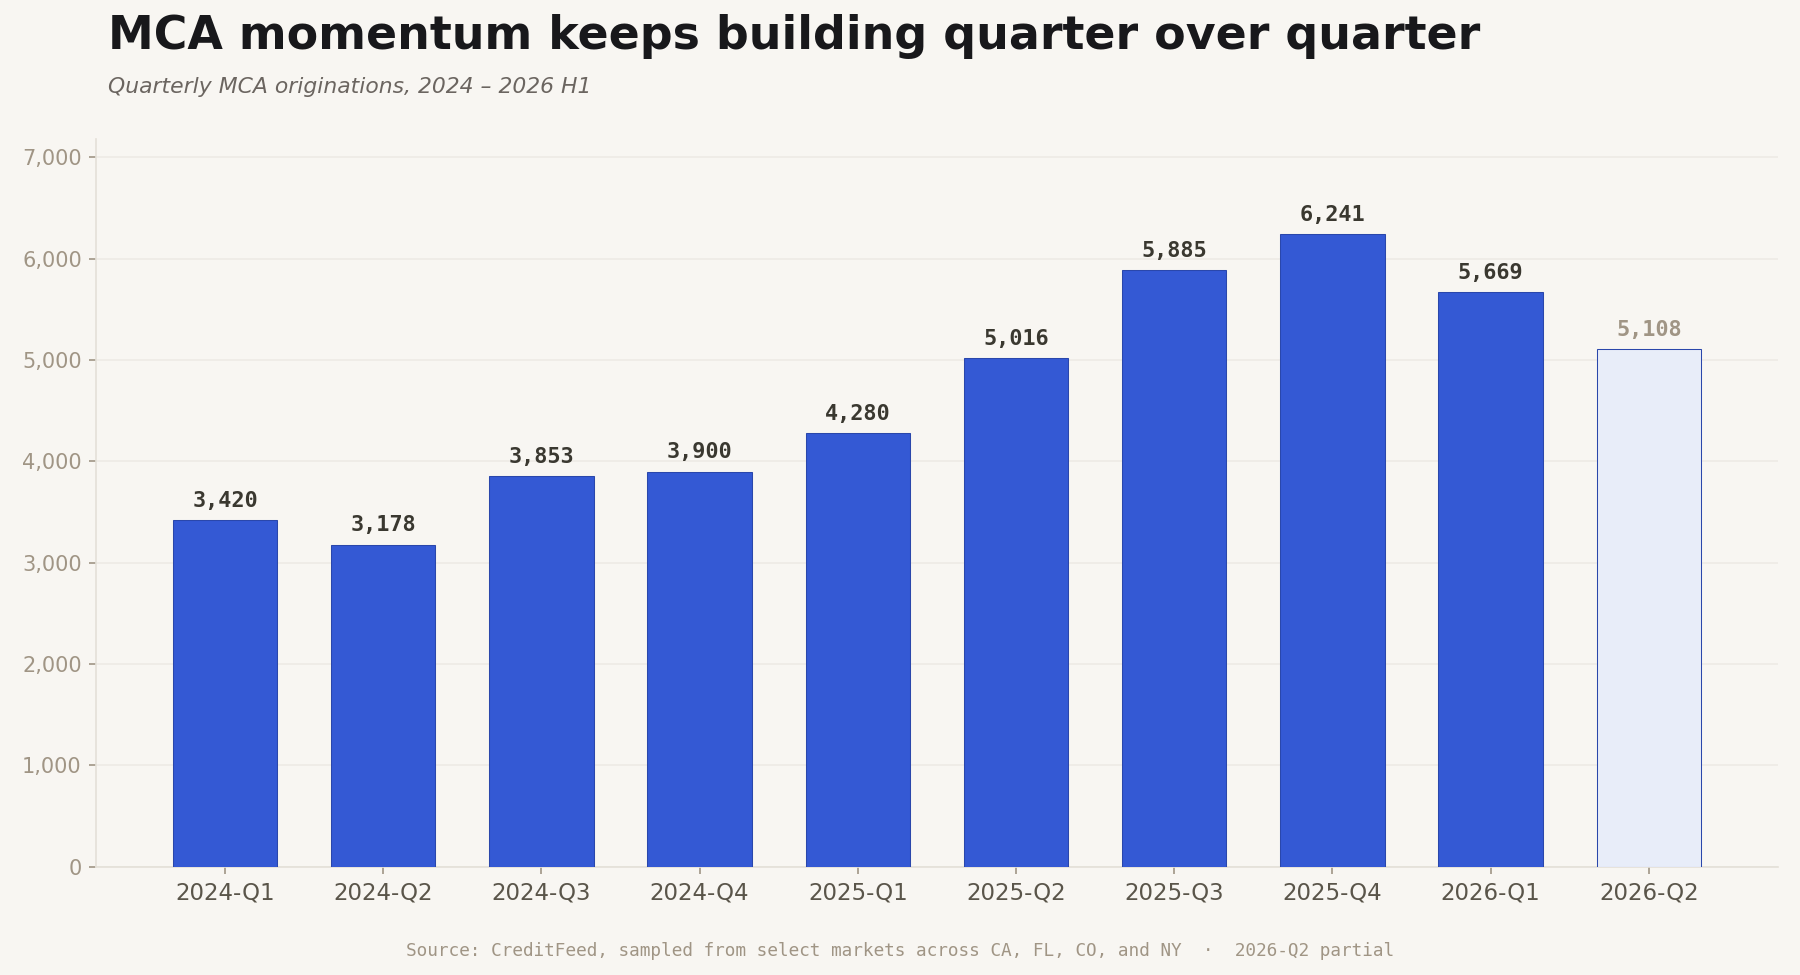
The market is not dead. The better question is where the growth is coming from.
Growth is coming from more merchants, not just more stacking
If MCA growth were mostly the same borrowers taking more and more advances, the financings-per-borrower ratio would be climbing fast.
It is not.
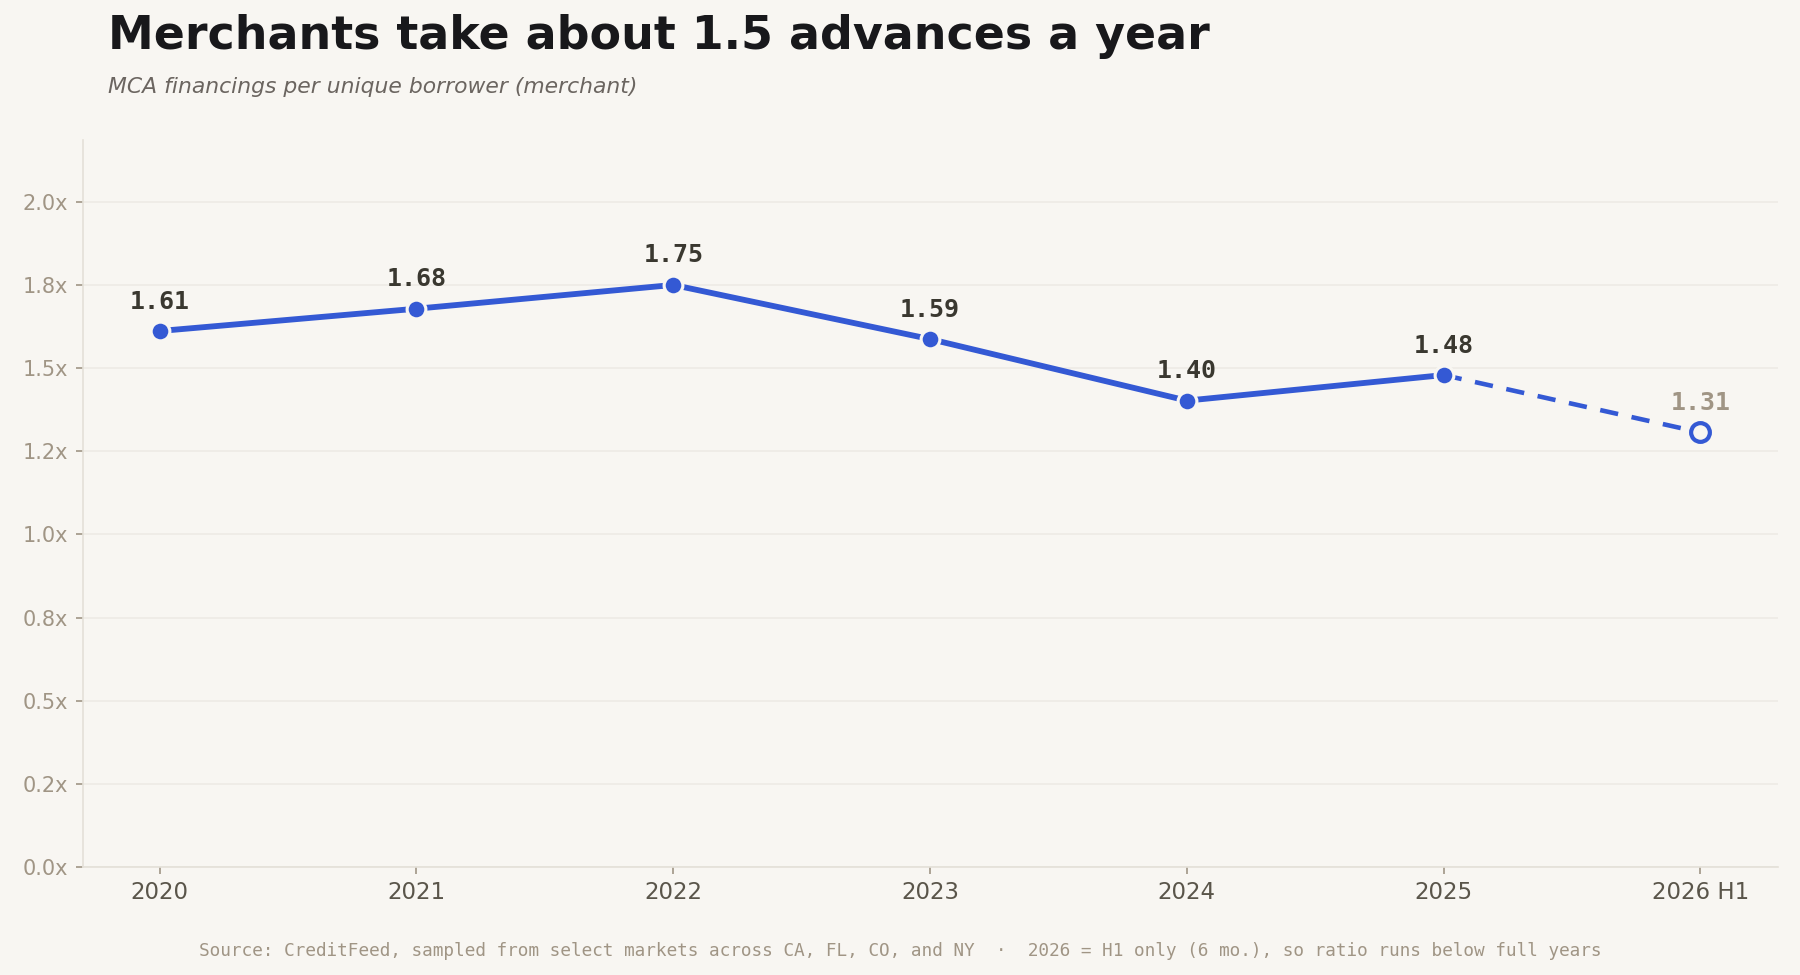
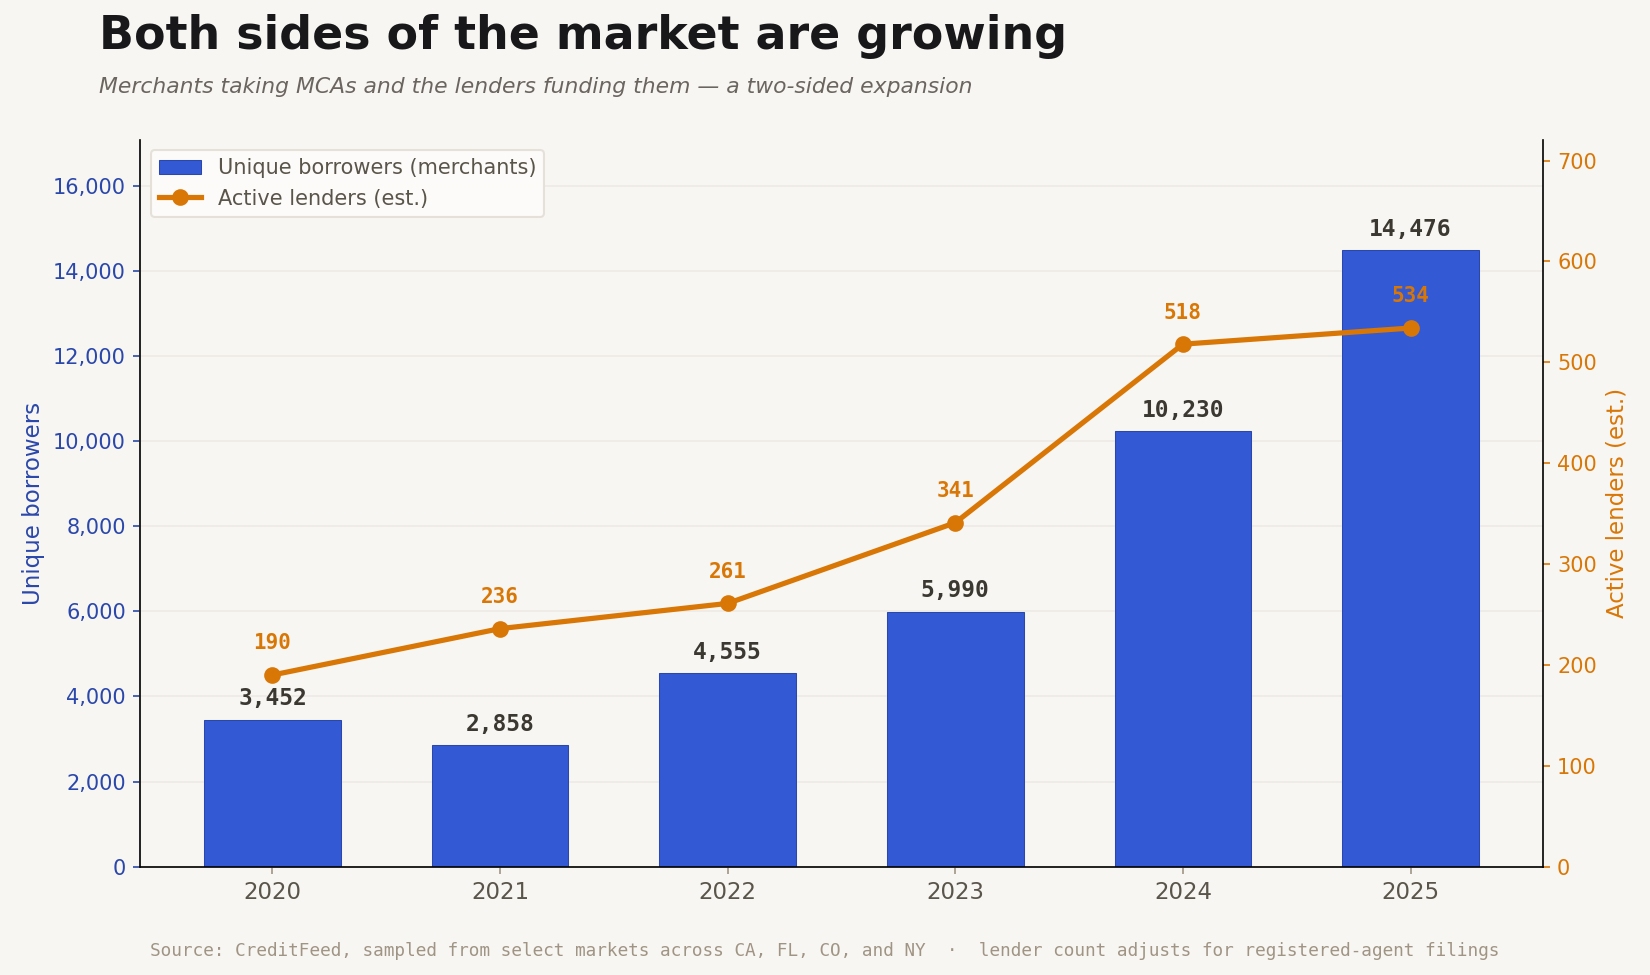
Financings per unique merchant have stayed around 1.5x per year. Meanwhile, unique MCA borrowers grew +41% in 2025.
Look at both sides together and the pattern is clearer: more merchants are entering the funded pool, while active lenders are not expanding at the same rate.
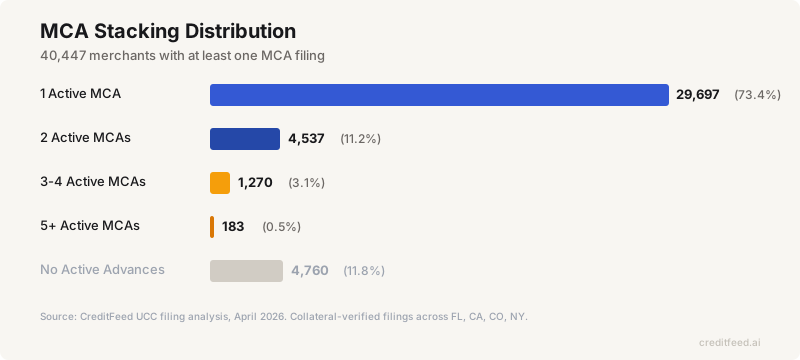
That changes the practical takeaway for brokers. If the borrower pool is expanding and the average funded merchant still takes about 1.5 advances per year, the edge is not only reworking the same stacked accounts. The edge is finding newly active merchants earlier, then timing the next outreach around the renewal window.
A funded merchant is not a one-time lead. It is a future opportunity with a clock attached.
The funder side is concentrating
The merchant side is broadening. The funder side is not broadening at the same pace.
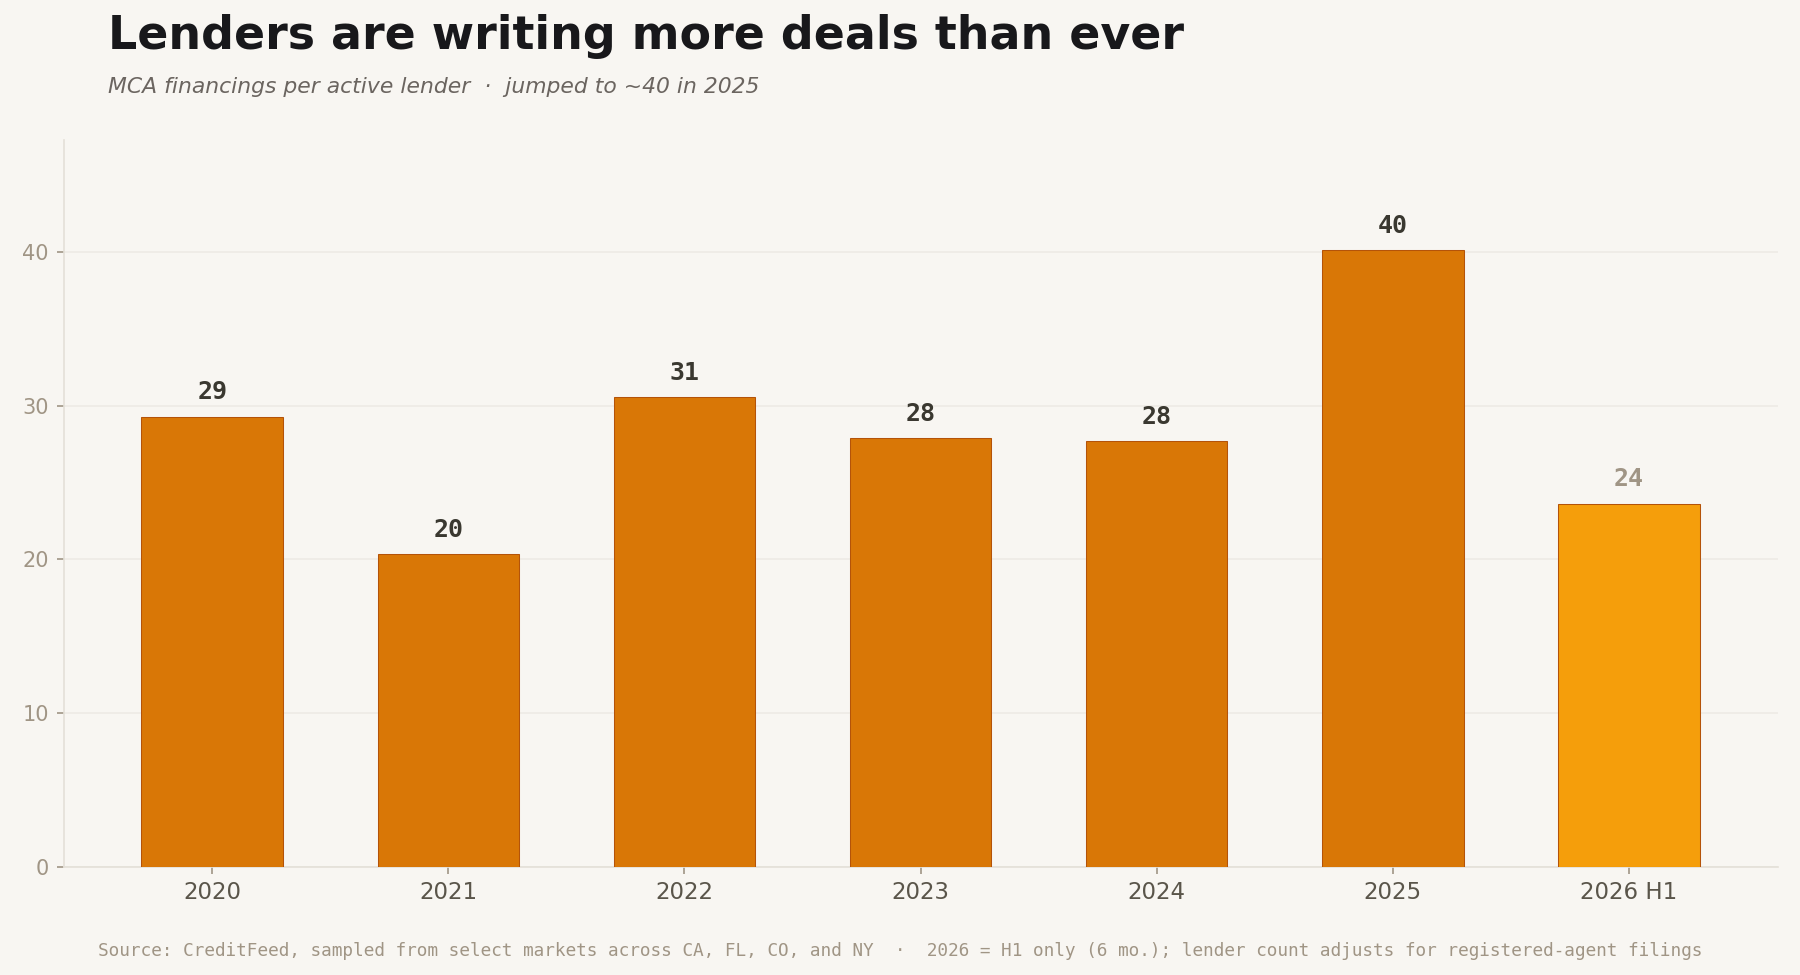
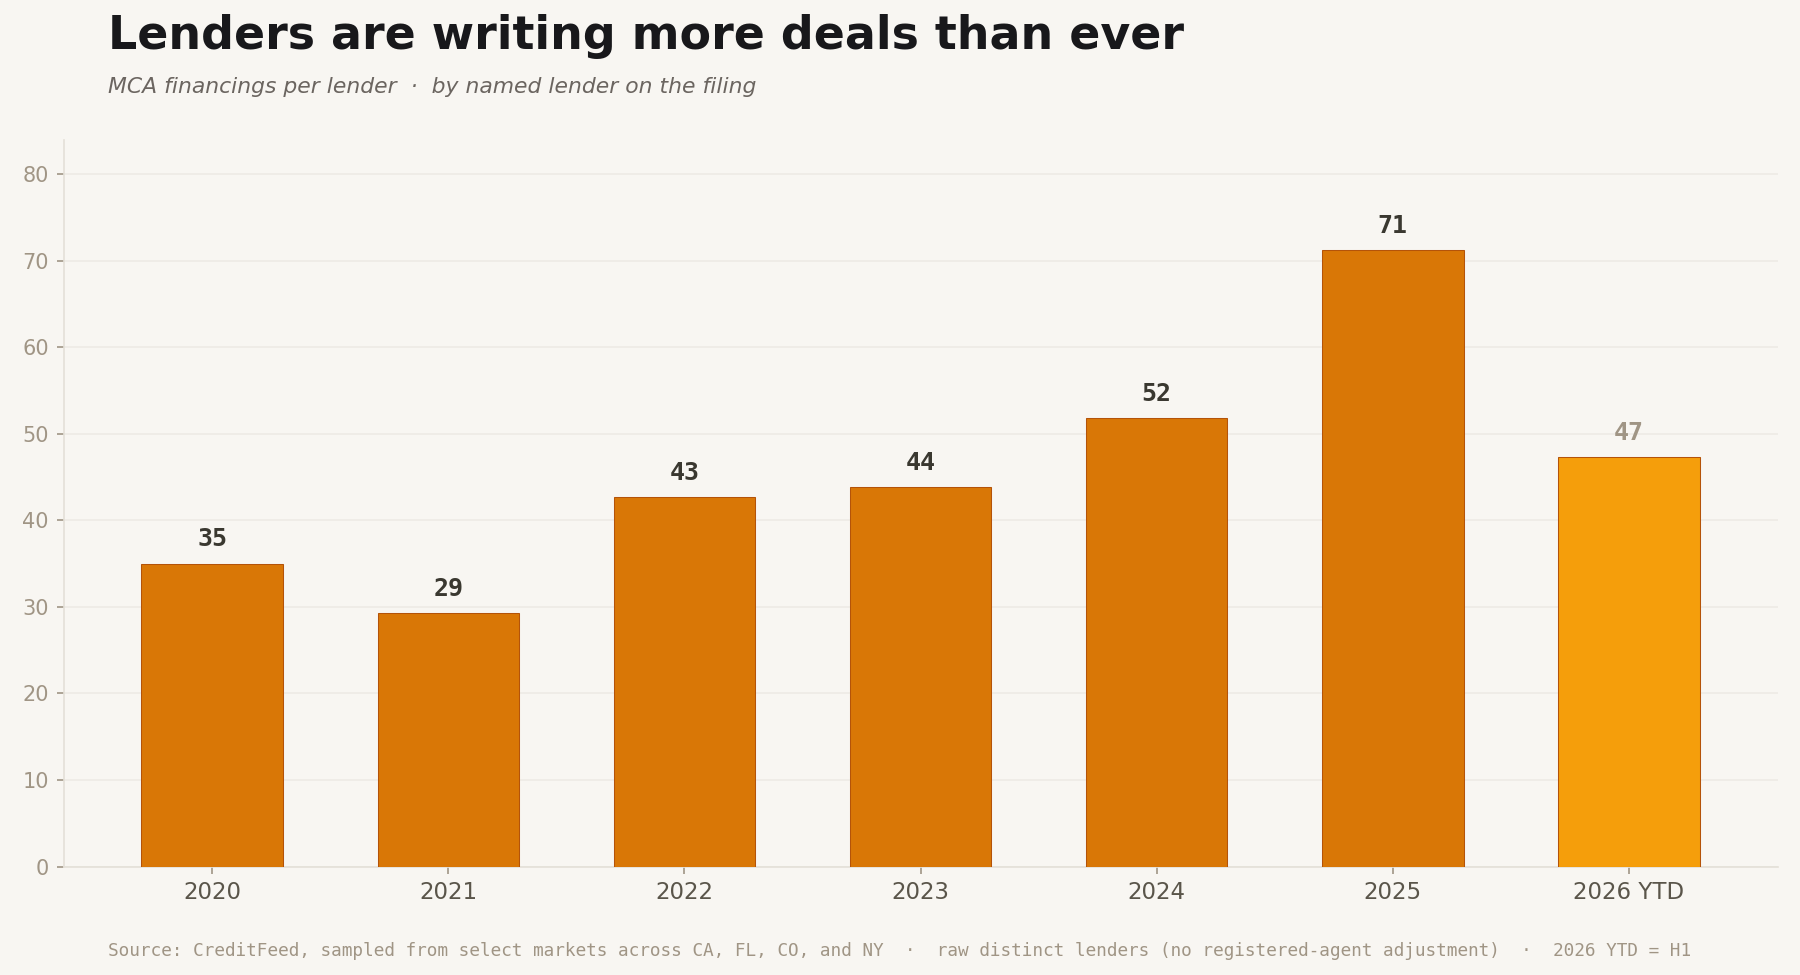
The number of active lenders barely moved in 2025, but the number of deals written per lender moved sharply higher. In the forum version, we summarized this as deals-per-lender jumping from roughly 35 to roughly 71 while lender count grew only about 3%.
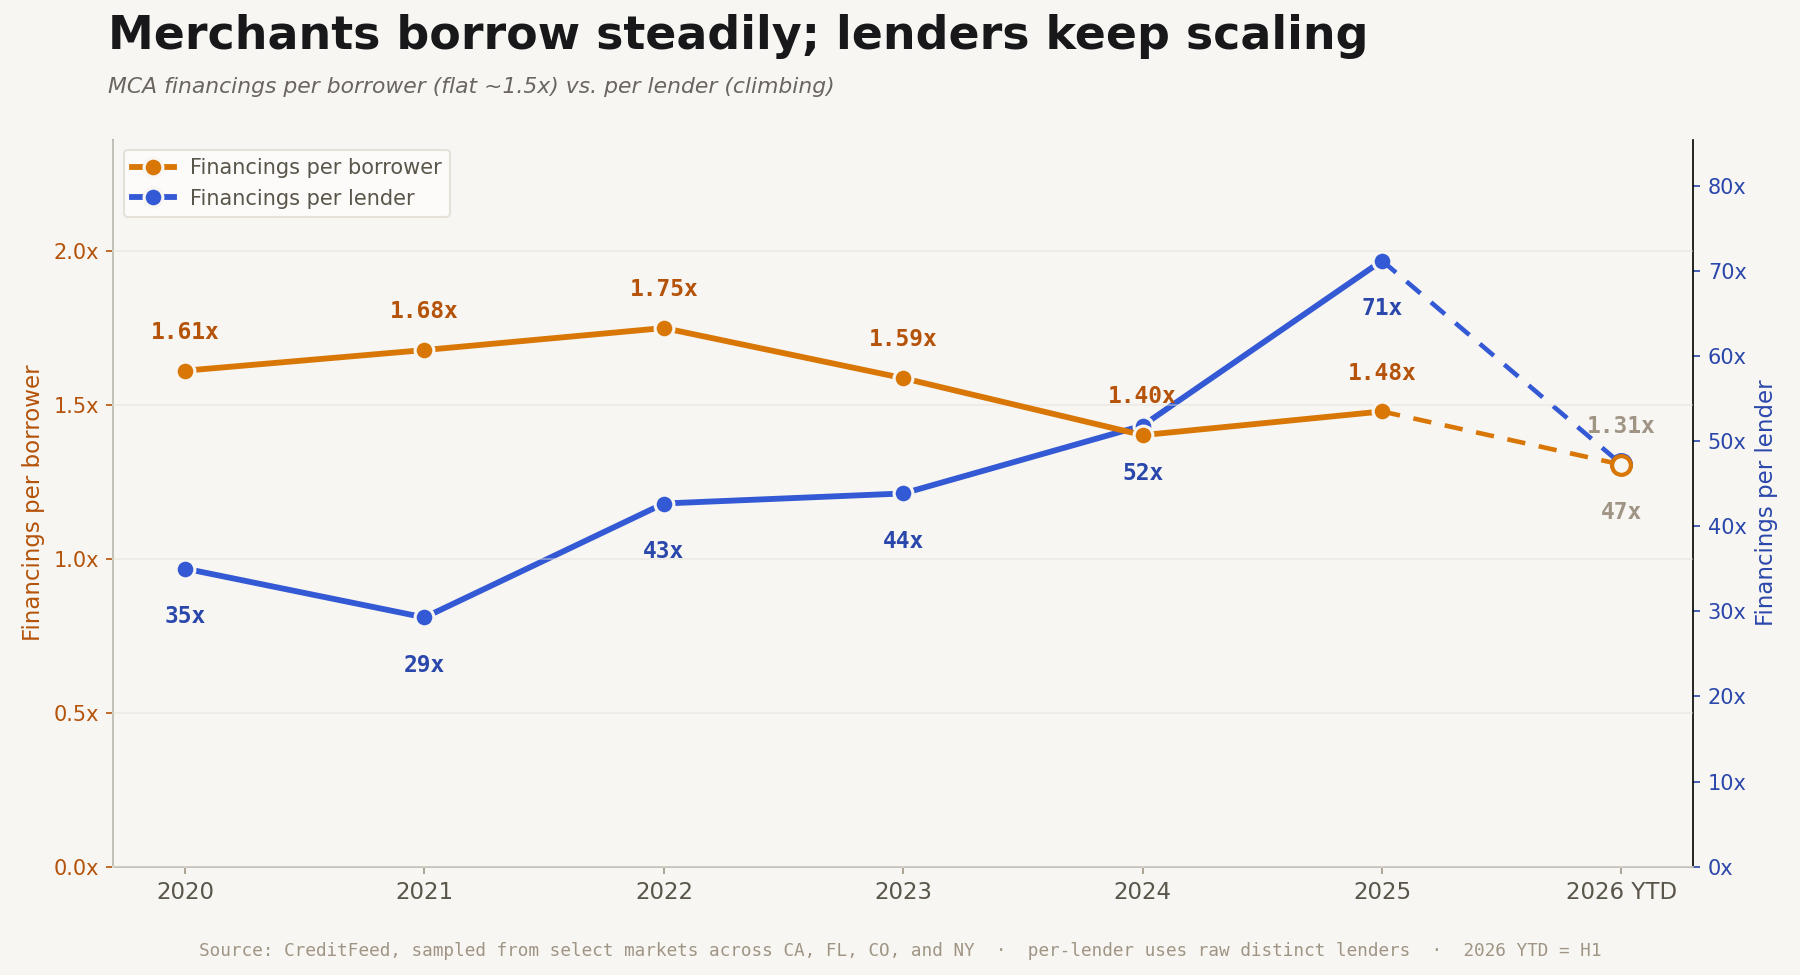
That is the part of the market that can make "growth" feel bad.
More merchants are taking capital, but more of that capital is flowing through a relatively stable set of active shops. If you are submitting into the wrong queues, the market can be up and your desk can still feel slower.
This is also why lender activity matters more than generic MCA volume. A broker does not get paid because the market is larger. A broker gets paid because the right funder is actively writing the right paper this month.
The raw named-lender view is even more concentrated, because registered-agent filings can obscure which funder actually wrote the paper.
The growth is not one-state noise
The sampled markets cover different filing systems and different regional economies. The pattern still shows up across states.
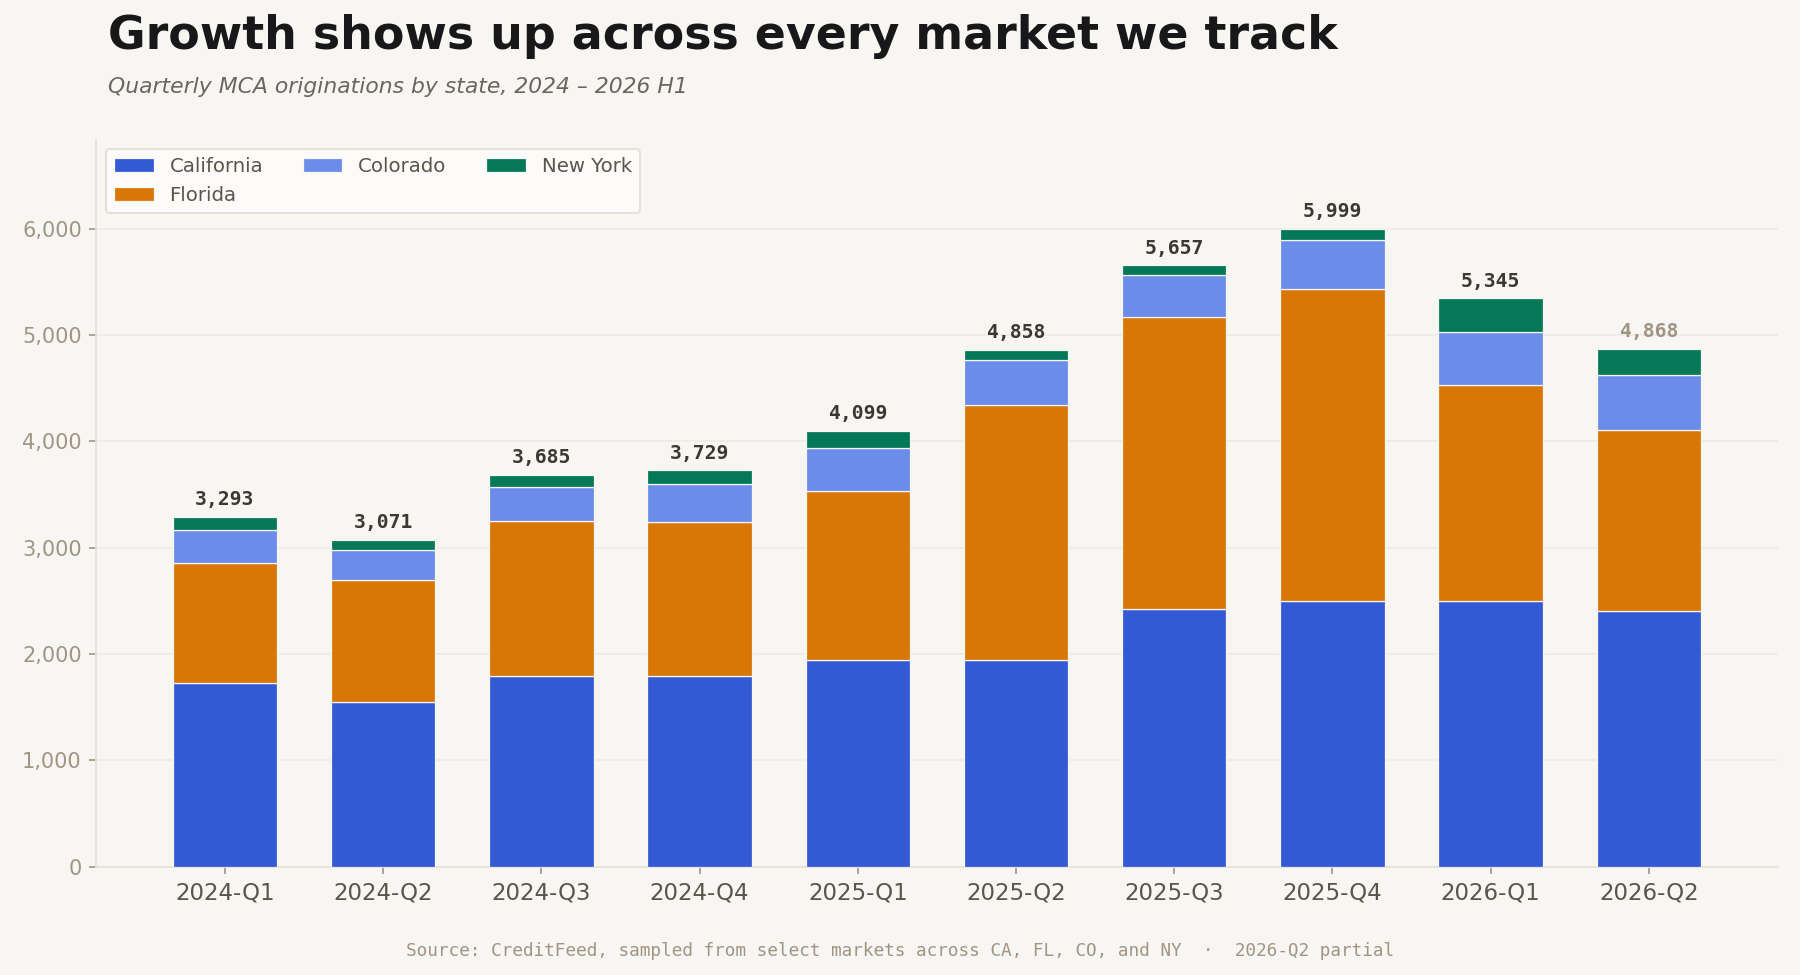
This does not mean every state, every vertical, and every funding box is equally healthy. It means the top-line "MCA is dead" claim does not fit the filing record.
The better read is that growth is uneven. Some markets are expanding fast. Some channels are getting crowded. Some borrowers are getting harder to underwrite. Some funders are scaling while others are retreating.
That is not a death story. It is a market-structure story.
National estimates point the same way
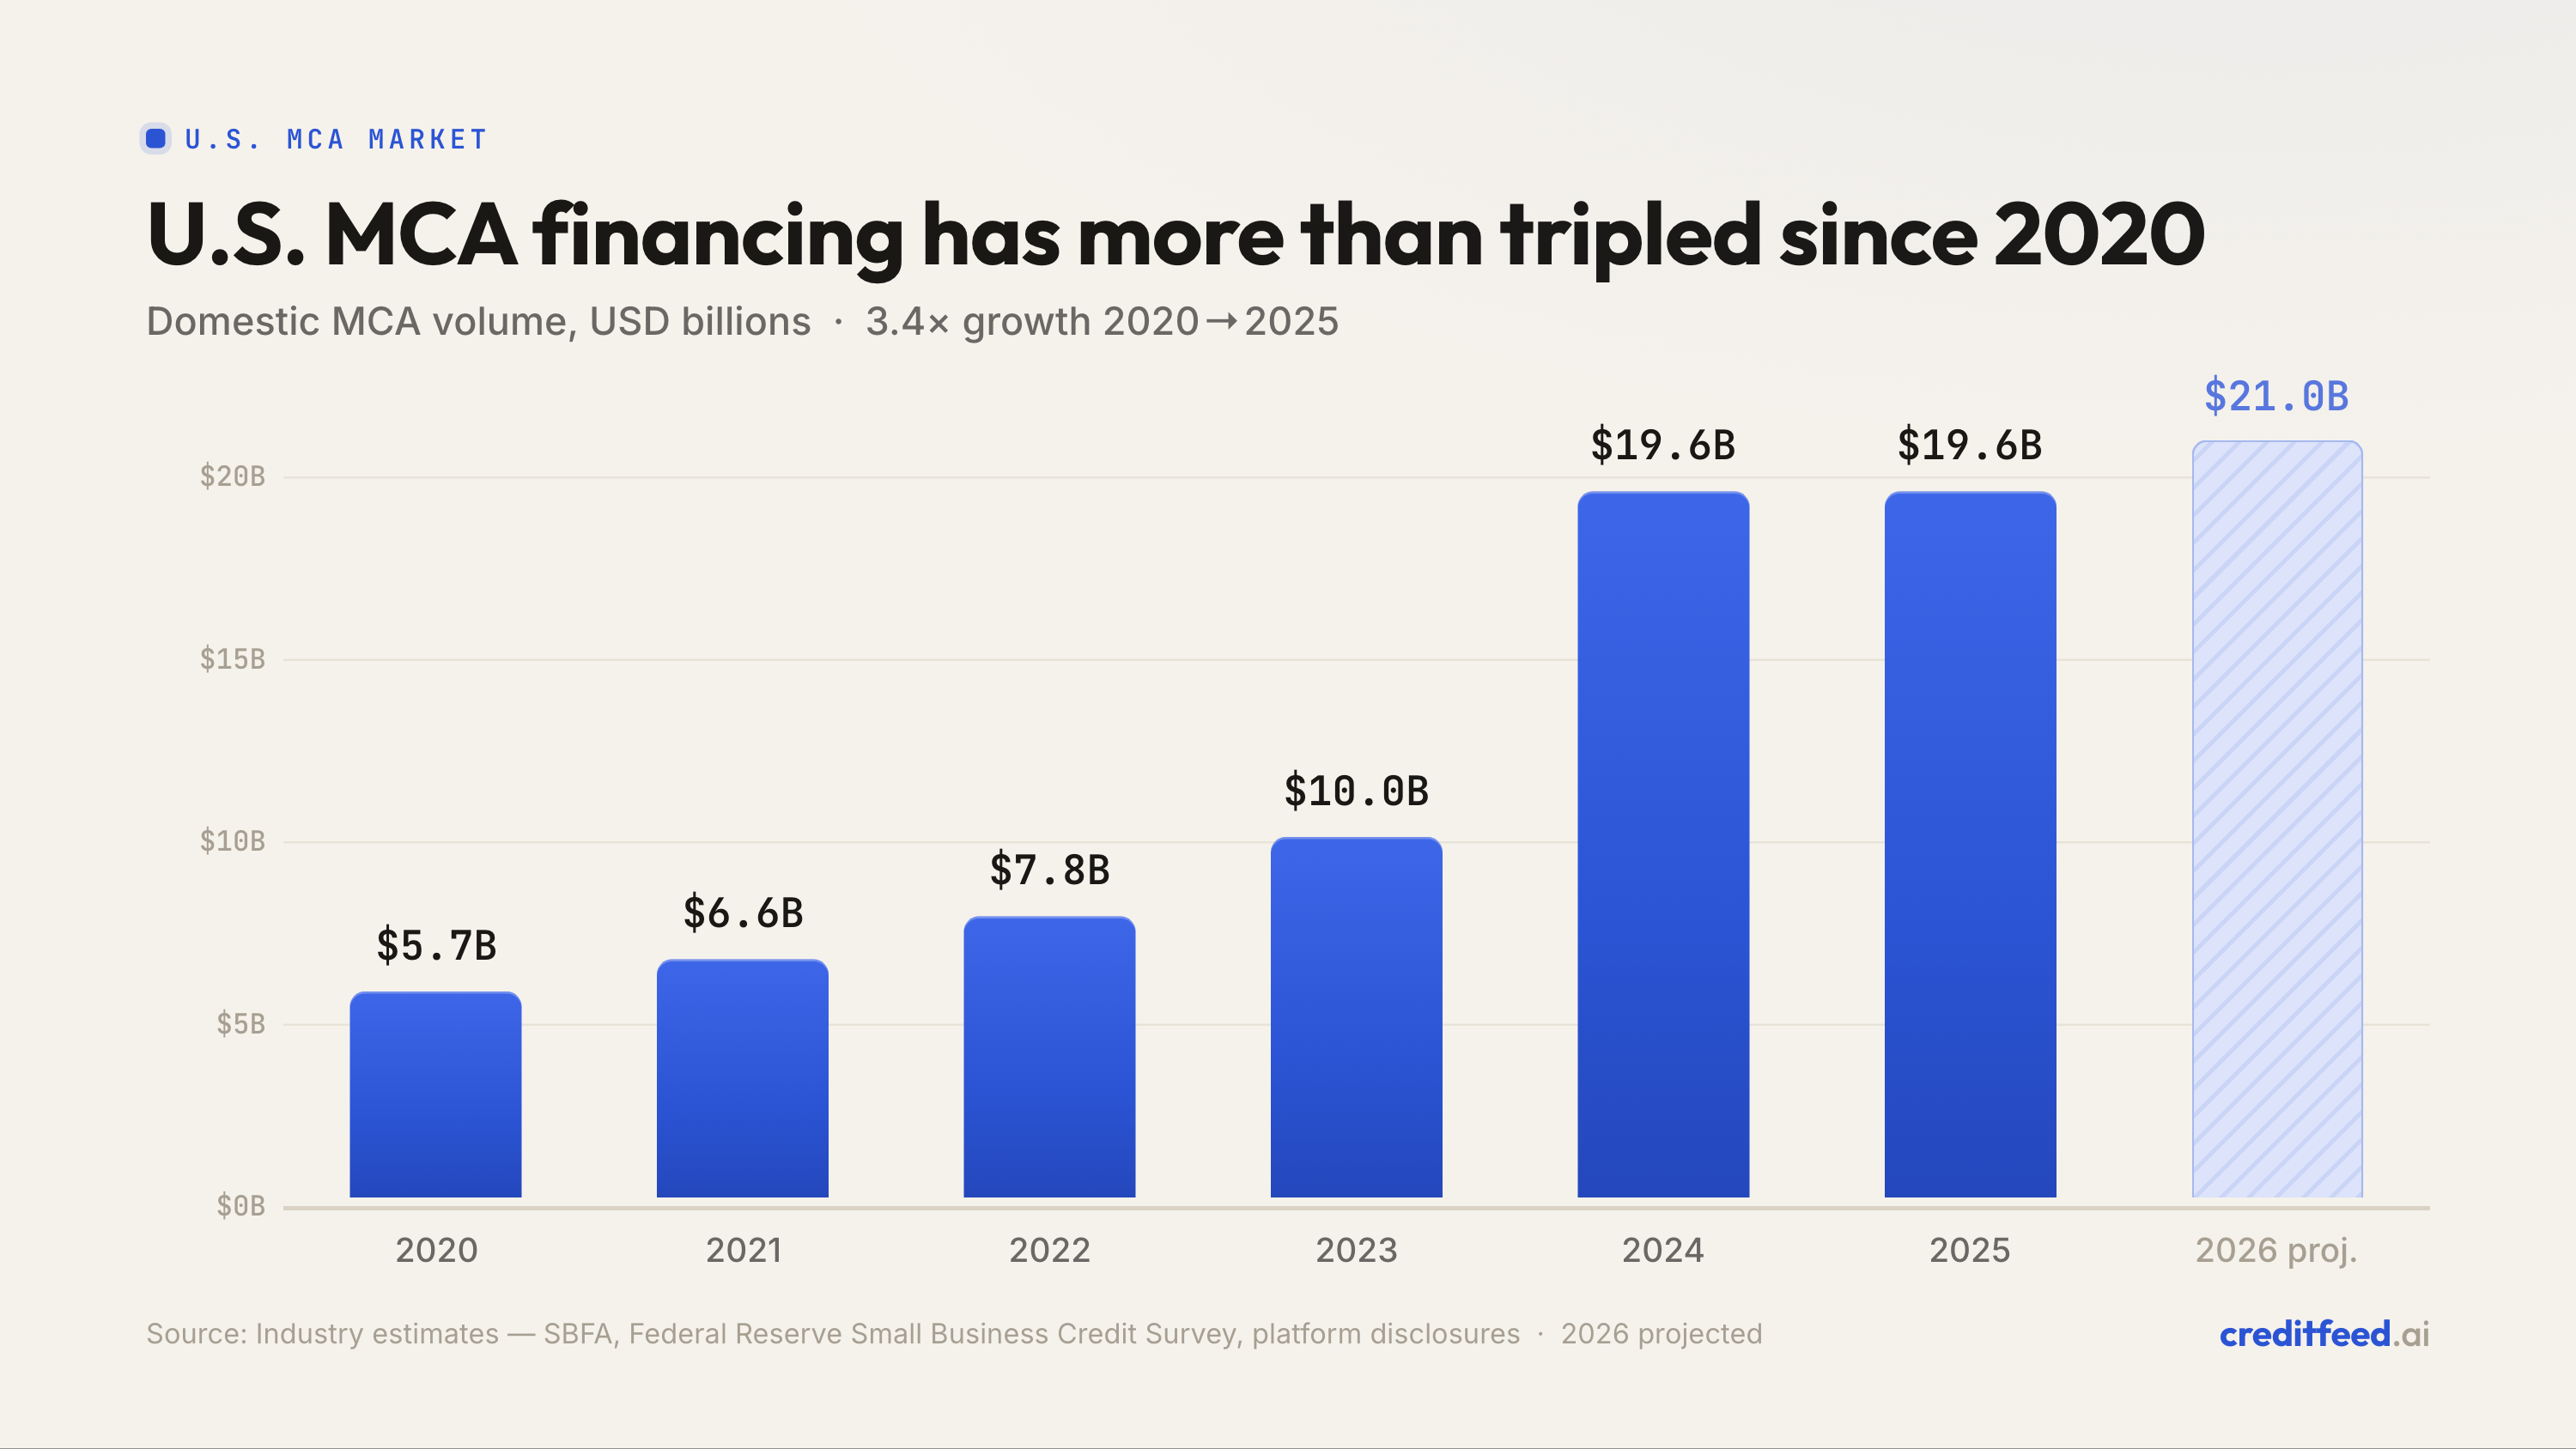
The filing sample is useful because it is observable and timely. Top-down industry estimates point in the same direction.
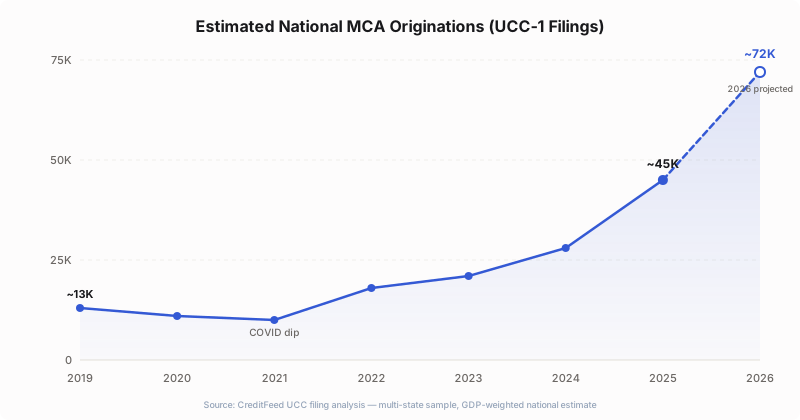
U.S. domestic MCA volume is estimated to have more than tripled from 2020 to 2025, with 2026 projected higher again.
This is where the forum pushback was fair. Growth does not mean the market is clean.
Some of the new volume includes weak files. Some includes backdoored merchants. Some includes borrowers getting pulled into debt settlement. Some includes merchants hit by fake LOC pitches before they ever reach a legitimate funder. Embedded lenders like Square, Shopify, Clover, and DoorDash are also changing how merchants encounter capital before a broker ever calls.
Those are real problems. They just do not prove MCA is dead.
They prove that the old operating model is under pressure.
What brokers should do with this
If you believe the market is shrinking, you optimize for defense. You call the same lists harder, chase the same aged renewals, and blame the close rate.
If you believe the market is growing but getting more competitive, the playbook changes.
First, prospect earlier. The strongest opportunities often show up before the first MCA filing, through adjacent distress and alternative-credit signals: tax liens, government liens, fresh blanket liens, or multiple non-bank lenders already on the business.
Second, track renewal timing. A 1.5x annual financing pattern means funded merchants come back with some regularity. The question is whether you know when the window opens.
Third, follow active funders, not generic lender lists. If capital is concentrating, the top active shops matter more. Which funders are writing more this quarter? Which are backing off? Which industries are they actually touching?
That is where the filing record turns into an operating edge.
Methodology
This analysis uses CreditFeed's UCC filing classification for new originations where the collateral indicates future-receivables financing, the standard public-record proxy for merchant cash advances. The chart set was generated from sampled markets across California, Florida, Colorado, New York, Connecticut, and Kentucky.
The sample is not national and should not be read as total U.S. MCA count. It is intended as a directional market read across multiple major filing jurisdictions. The 2026 figures are year-to-date and include normal state reporting lag. Lender counts are shown both raw and adjusted where registered-agent filings obscure the actual funder.
MCA is not dead. It is bigger, noisier, and less forgiving than it was.
The shops that win from here will not be the ones arguing whether the market is alive. They will be the ones watching where the next borrower, next renewal, and next active funder show up first.
CreditFeed tracks MCA filing activity, lender movement, renewal timing, and borrower signals from UCC data. Explore the market on CreditFeed.