The Rise of Fintech in MCA: A New Playbook for Brokers & ISOsPart 2: What Fintech Does Better, and What It Cannot Do
Fintech beats the broker channel on lead cost, speed, and price, and those gaps are structural. It also cannot see half the market, cannot size off a whole business, cannot be a second position, and cannot see a merchant it did not fund. Four things for ISOs and brokers to stop fighting, six openings to work.
Fintech took half the MCA market. It did not take half the merchants. Platforms genuinely win on lead cost, speed, price, and repayment structure. Those four gaps are structural and no broker closes them.
They also cannot see half the market, cannot size off a whole business, cannot be a second position, cannot stop charging more when a merchant grows, cannot make an exception, and cannot see a merchant they did not fund.
Four things for ISOs and brokers to stop fighting. Six openings to work.
Part 1 covered how the market got here.
They never pay for a lead
Shopify is not prospecting anyone. It is deciding whether to put an offer in an admin panel the merchant already opens every morning. Acquisition cost is effectively zero.
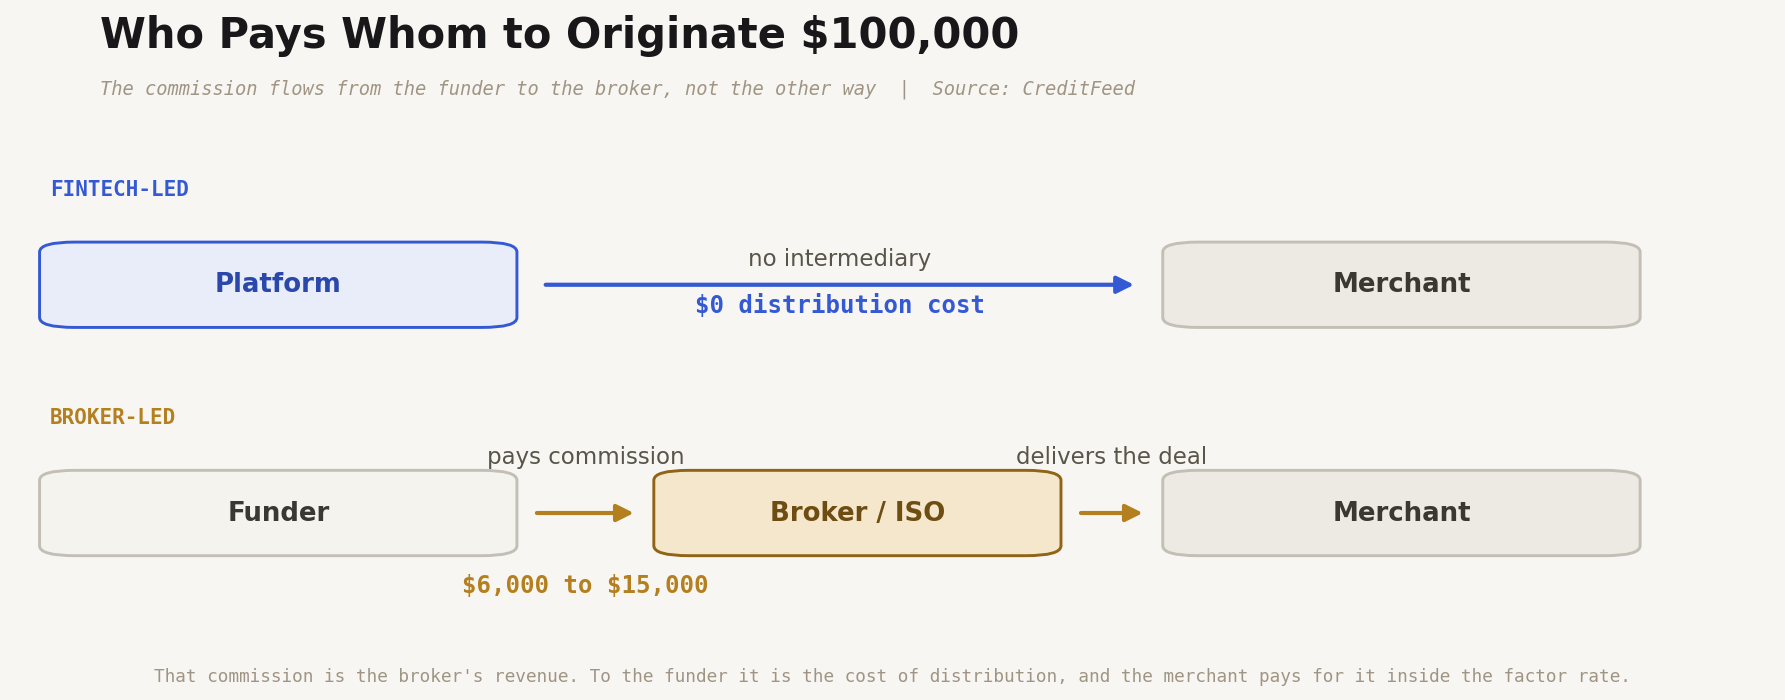
Getting a merchant in front of a funder is work, and someone pays for it. The funder does, in the form of 6% to 15% of the funded amount paid out to the broker or ISO who brought the deal.
That commission is broker revenue. It is also the cost of the channel, and it is the reason the two sides price differently. A platform originates for nothing because the merchant was already sitting in its dashboard. A funder originates by paying a distribution network.
The uncomfortable version: in this comparison, the broker's income is the cost difference. That is the trade the channel makes, and it is why price is the wrong battleground.
Do not fight this. No distribution network originates at the cost of no distribution network.
They decided before the merchant asked
There is no application. The platform watches sales volume, chargeback ratio, refund rate, and inventory velocity continuously, and the approval exists before the merchant goes looking. Funding lands in minutes to 48 hours with no tax forms, no bank statements, no identity check.
- •Sales volume, updated continuously
- •Chargeback and dispute ratios
- •Refund rate
- •Inventory and fulfillment velocity
- •Customer ratings and returns
- •3 to 6 months of bank statements
- •Average daily balance
- •Negative balance days
- •NSF return history
- •Existing recurring debits from other funders
- •Voided check, ID, corporate records
One side is a database query. The other is a document chase.
A broker file takes 3 to 6 months of statements through OCR, an underwriter reviewing average daily balance and NSF history, and then a shop across desks. Four to 48 hours on a good day.
Do not fight this. That gap does not close, and every hour spent trying to close it is wasted effort.
They are cheaper, and most of the gap is not greed
Fintech sits at a standardized 1.10 to 1.17. Broker paper runs 1.20 to 1.55 and up. The 6% to 15% from the first section is not a separate line item somewhere. Here is exactly where it lands.
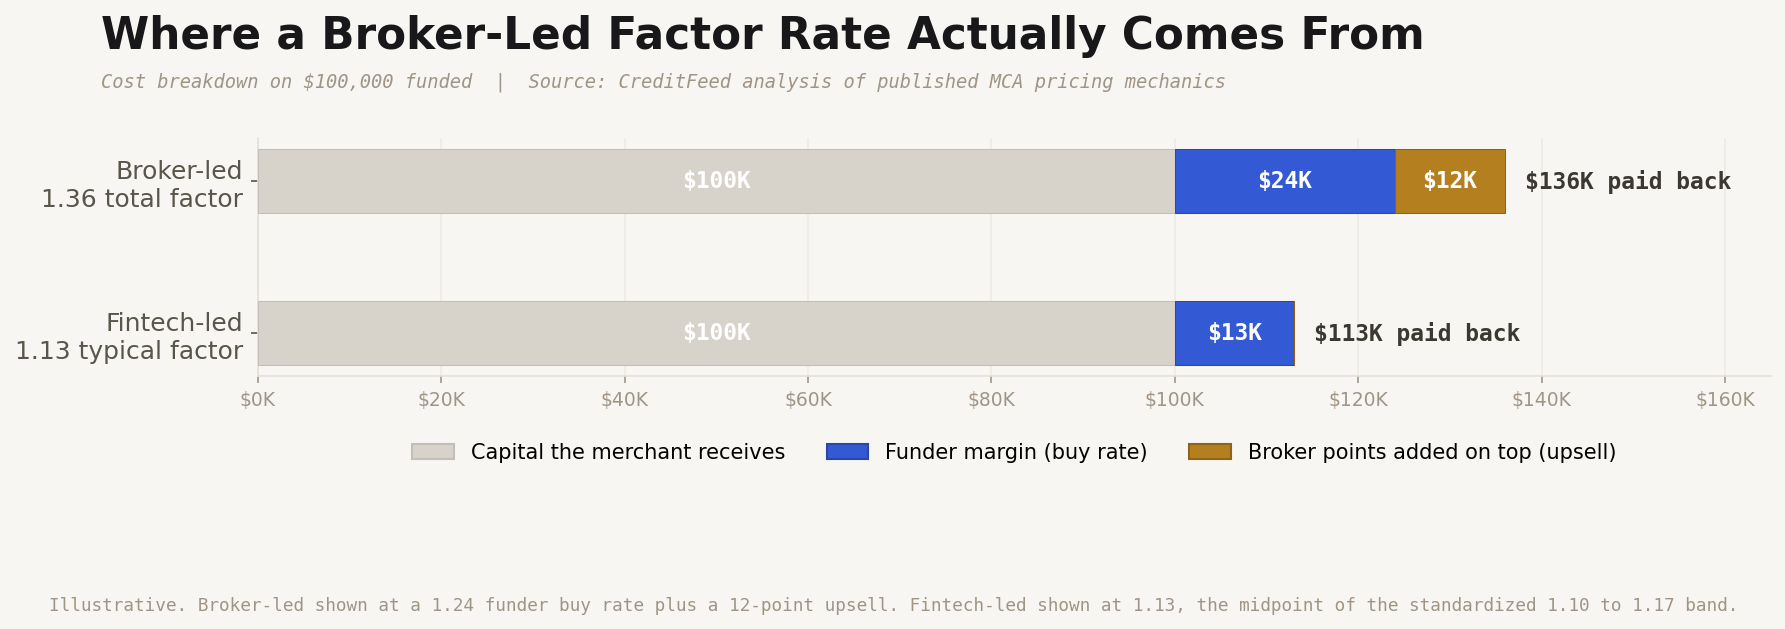
The funder issues a buy rate. The broker adds points on top. The merchant sees one number. On $100K at a 1.24 buy rate with 12 points of upsell, he pays back $136,000 instead of $124,000.
Those 12 points are $12,000, which is the commission from the first section, sitting inside the merchant's factor rate. The distribution cost and the price gap are the same money viewed from two ends.
Most of the spread against fintech is structural: no acquisition cost, automated underwriting, a captive collection rail. But the upsell layer is discretionary, and it is the part regulators are now looking at directly.
New York already requires broker fees itemized by name on a signed pre-execution disclosure. California restricts quoting a bare factor rate and forces estimated APR. Utah, Virginia, Florida, Georgia, and Missouri are adding registration and total-cost rules.
The upsell works because the merchant sees one number. These laws exist to unbundle that number. Platforms absorb it for free, because their compliance logic lives in the interface and there is no third party to police.
Do not fight this. Margin hidden in a quoted rate has a shelf life.
Their money gets smaller on a bad day. Broker paper does not.
Fintech takes 8% to 17% of each day's card batch before the rest ever settles to the merchant. Slow Tuesday, smaller payment. Zero sales, zero remitted. The merchant never holds the money long enough to miss a payment with it.
A broker-led fixed daily ACH pulls the same amount whether he did $400 or $4,000, and a return code triggers retries, fees, and collections.
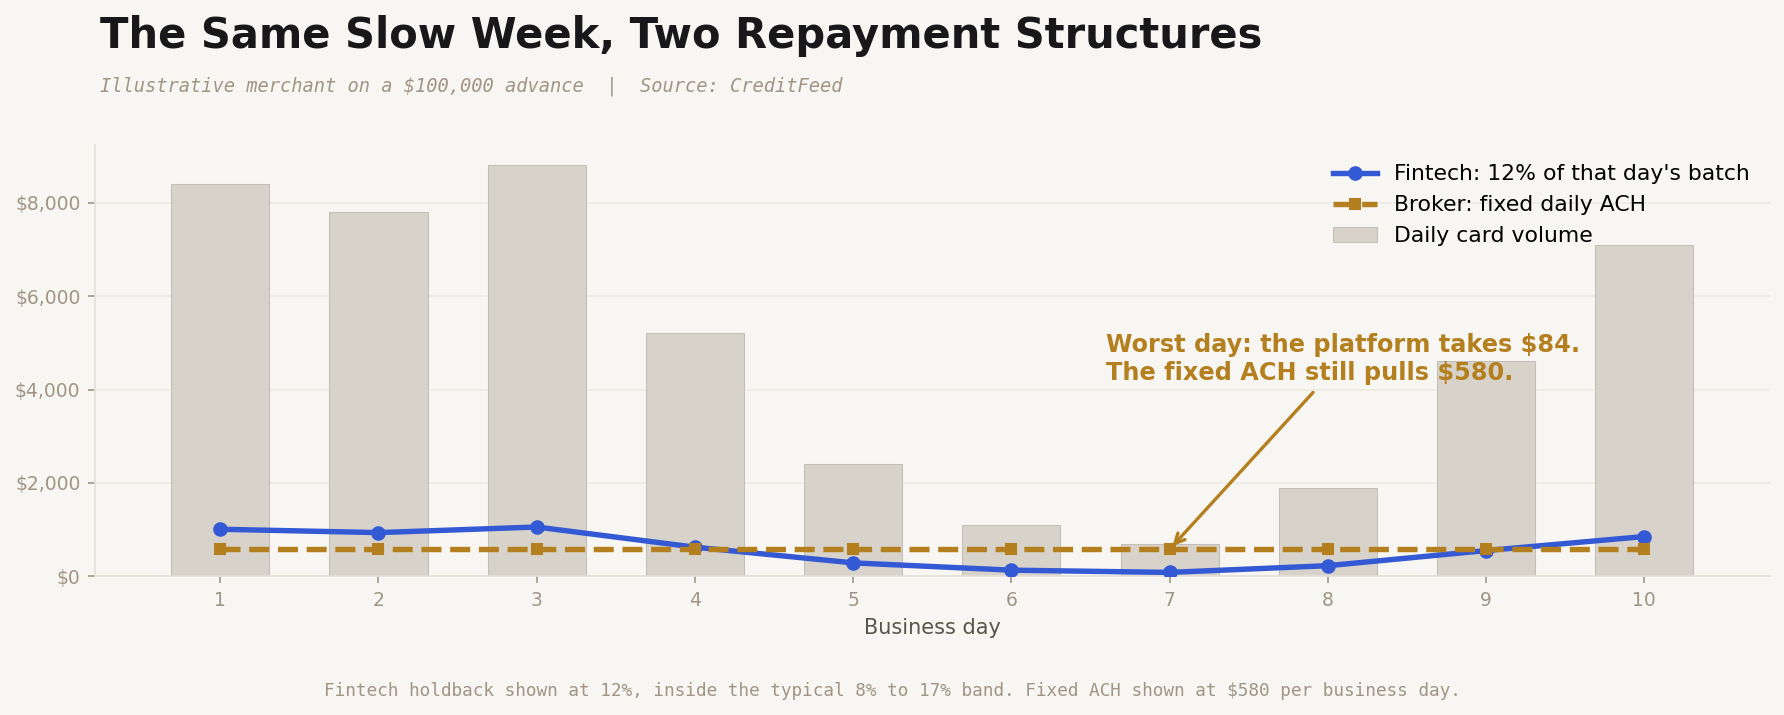
For a seasonal business, that is a real product difference and merchants feel it.
Do not fight this. It is a genuinely better repayment structure for a clean-fit merchant.
Everything above assumes one merchant profile: single channel, card dense, clean trending, needing an amount that fits inside a slice of their processing volume. For that merchant, take the loss and move on.
Here is everyone else.
It cannot see half the market
Embedded underwriting runs on card volume through the platform's own rails. A contractor billing progress draws does not have that. Neither does an agency billing net-30 or a carrier waiting on freight settlements.
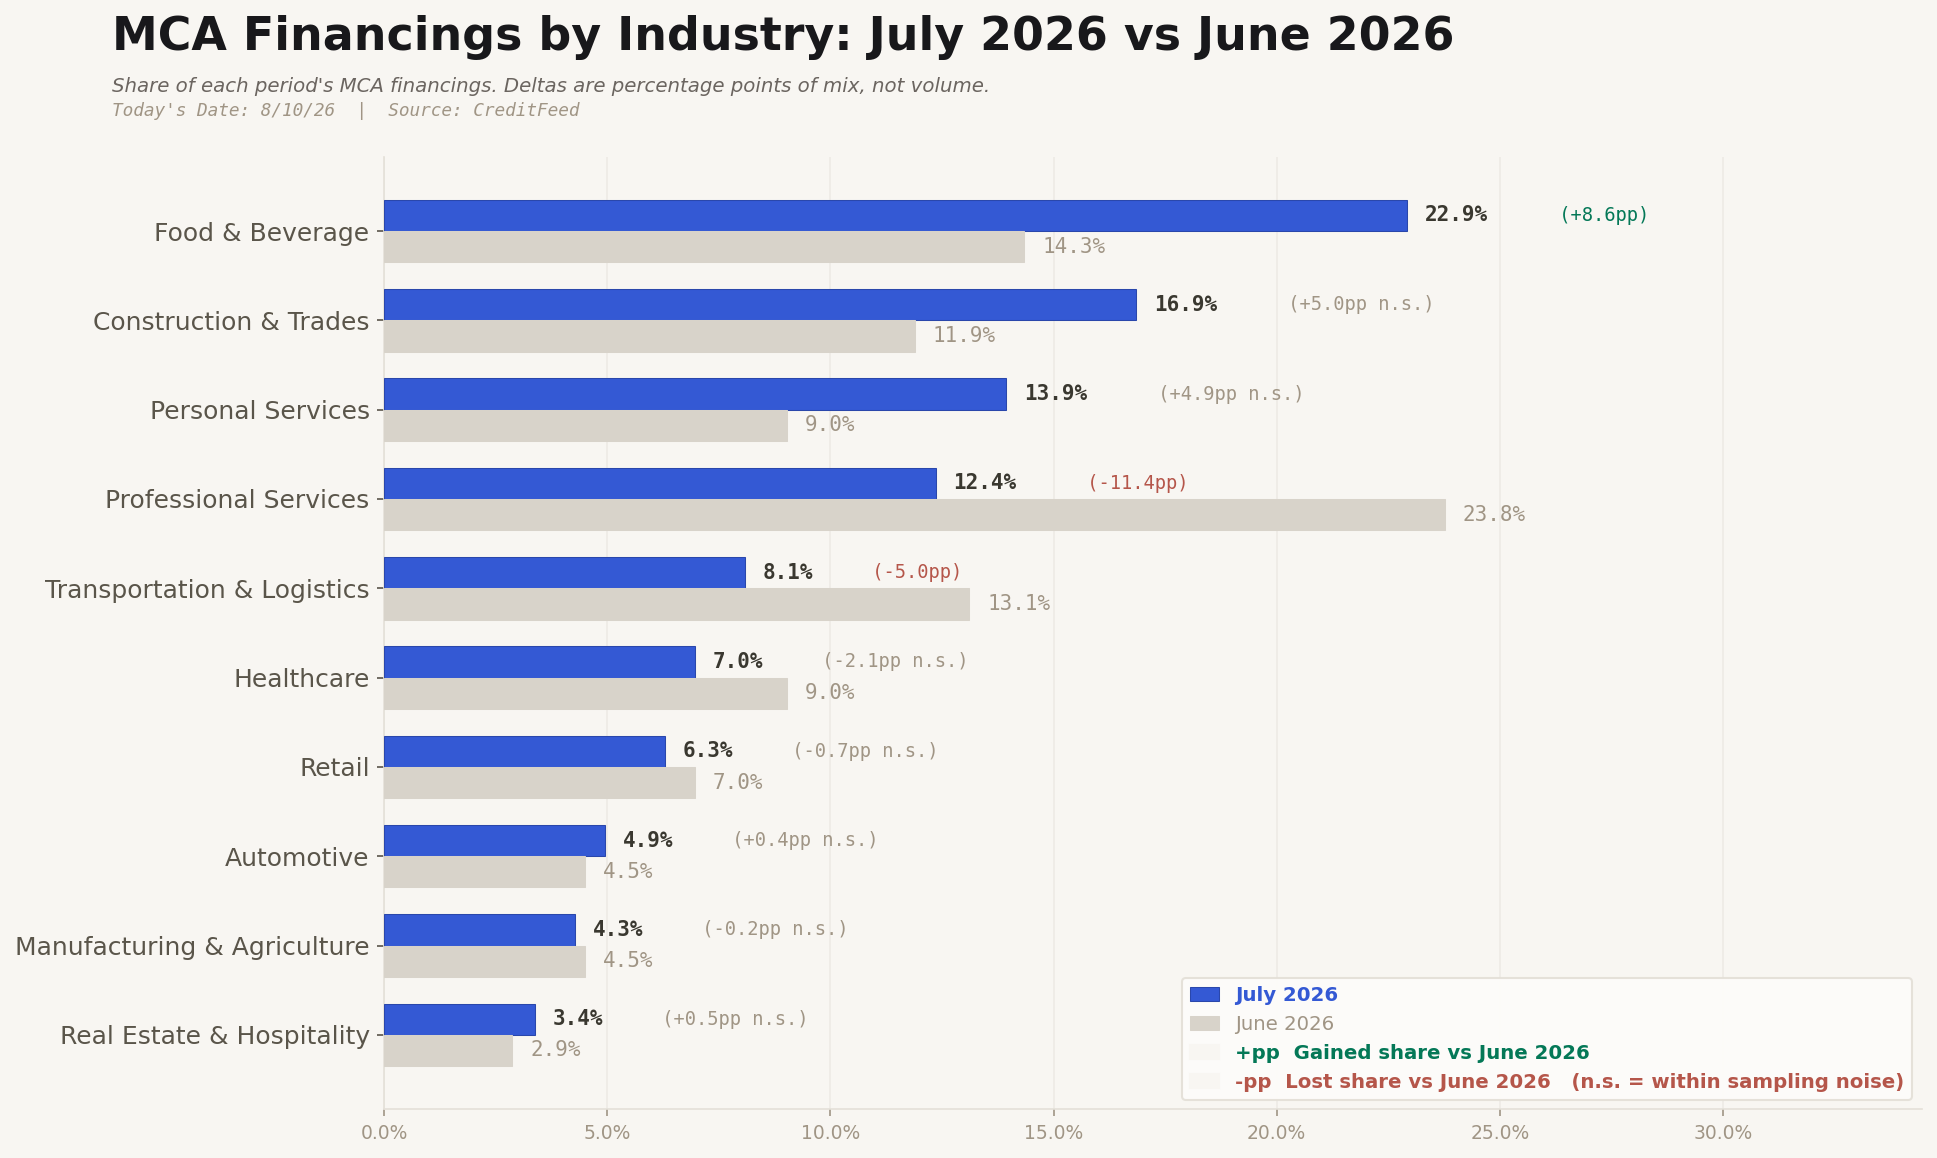
We split July's broker-led financings by revenue type.
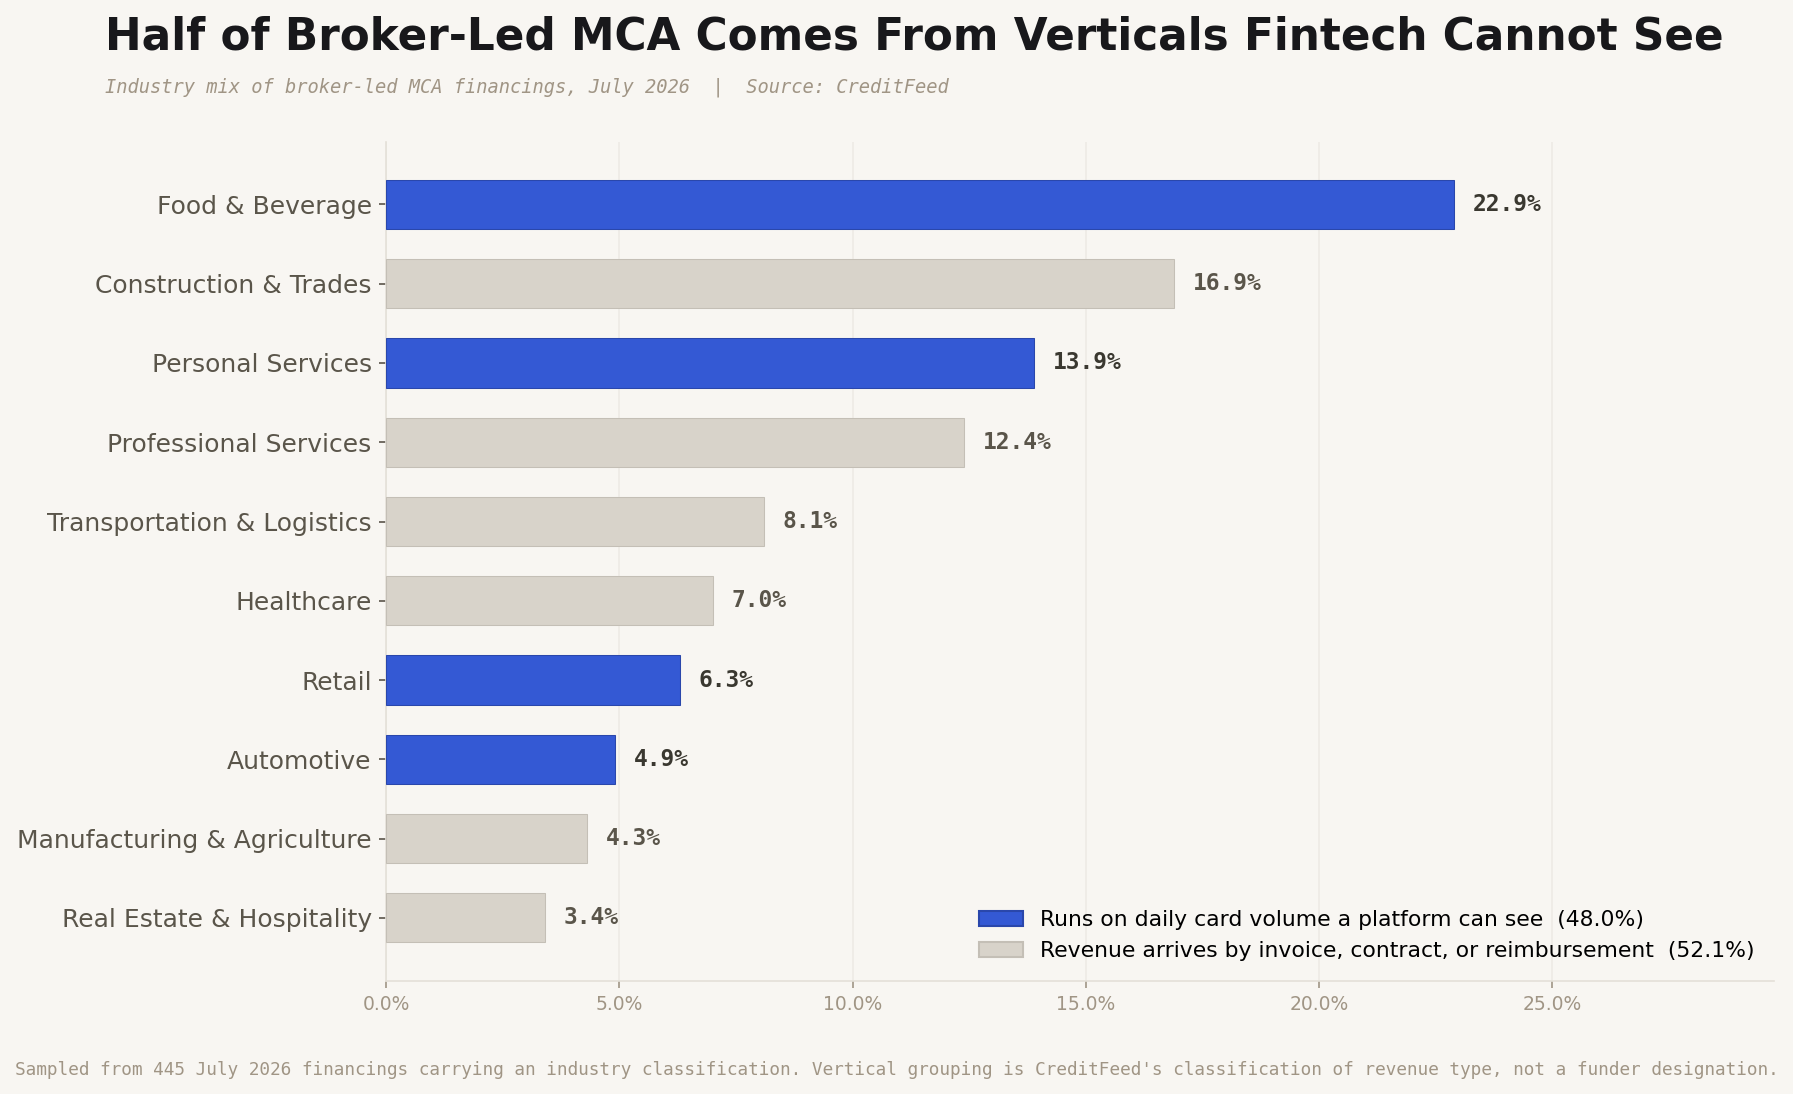
52.1% of broker-led volume comes from verticals no platform can underwrite. Construction alone was 16.9%. Retail, the vertical fintech targets hardest, was 6.3% of our sample.
That is a 445-financing sample for July and the revenue-type grouping is ours, so read the split as directional. The direction is not subtle, and it does not close. No algorithm gives a POS system sight of an invoice.
Monday: industry is not a preference. It is a read on whether Square could have taken the deal at all.
It cannot size off the whole business
Square sizes at a fraction of processing volume and caps near 20% of it. Shopify calibrates to store sales. Every platform number is a percentage of one channel.
Brokers size off total deposits. Same merchant, different denominator, different answer.
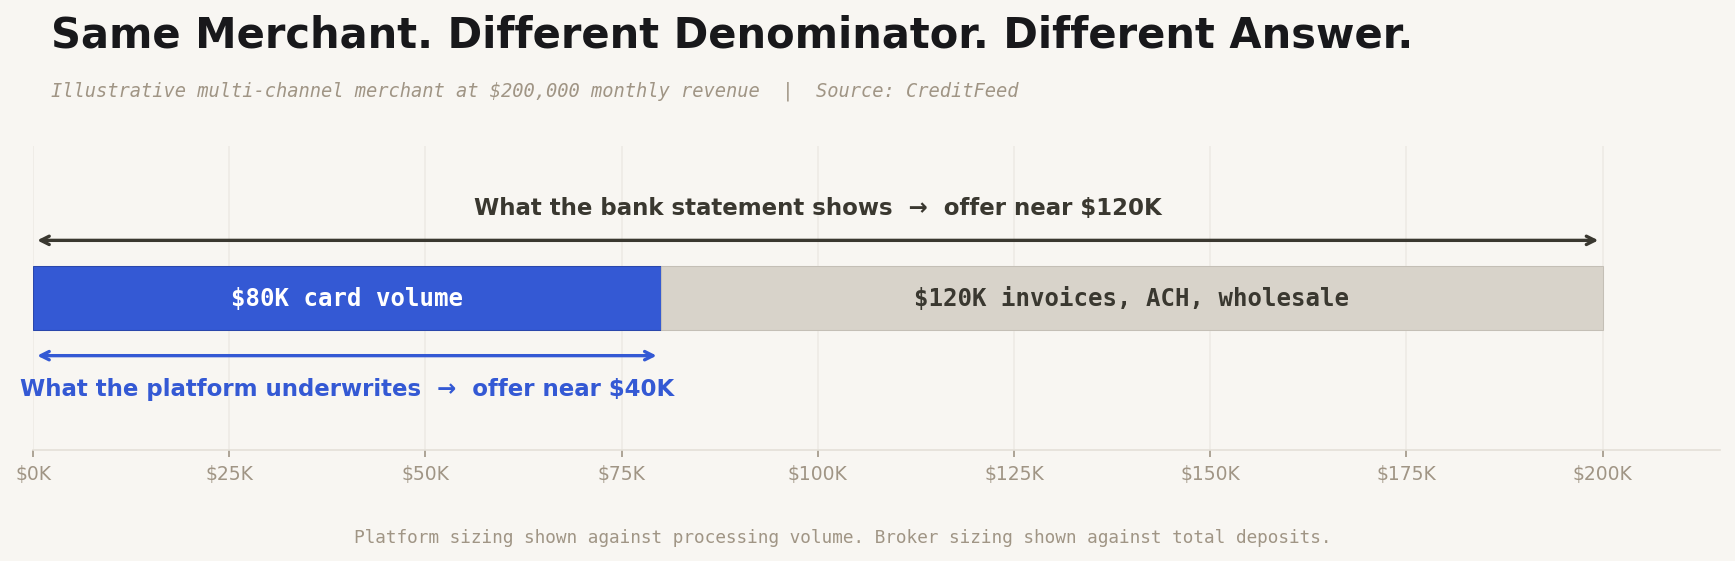
A merchant offered $40K against card volume who needs $120K against the actual business has not been served. He has a gap. And at the top end the broker channel writes bigger paper than the platforms do, because it can syndicate and they cannot. There is no consortium of platforms pooling capital for a merchant who outgrew the model.
Monday: approved-but-capped is not a lost lead. It is the best-qualified one in the market.
It cannot be the second position
Platforms block second positions by design. Closed-loop settlement, anti-stacking covenants, and real-time monitoring that freezes further extensions the moment volume dips.
So when a merchant needs more than the platform allows, there is exactly one path.
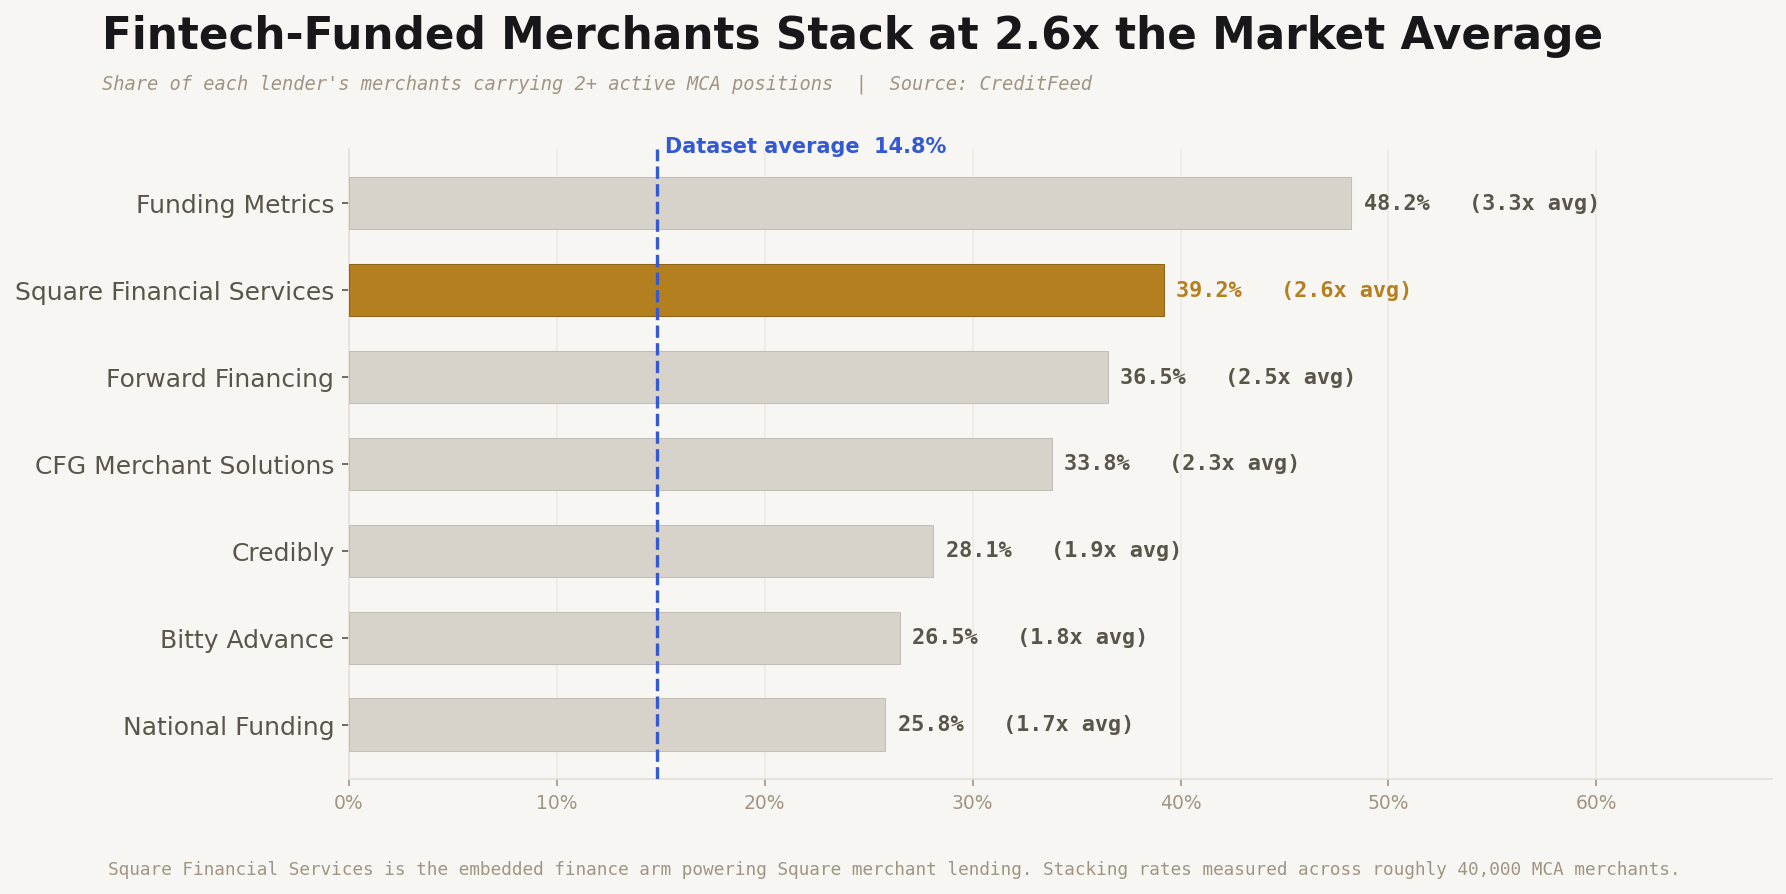
Square Financial Services merchants carry a second active position at 39.2%. The market average is 14.8%.
That second position is not another Square advance. Square will not write it. It comes from a funder outside the platform, which is the whole point.
The assumption is that a merchant funded by Square is a merchant lost to Square. The data says the opposite. Platform advances are cheap, easy, and capped, so merchants take them early and then need more.
They arrive pre-qualified by a live-data underwriter, with proven volume and a clean chargeback profile. No lead list carries that.
Monday: a platform lender on the file is a buy signal, not a closed door.
It cannot stop punishing growth
A factor rate is a fixed dollar cost, not accruing interest. So the effective APR depends entirely on how fast the money comes back.
Fintech takes a percentage of every batch. Great quarter, faster payoff, shorter window, higher effective APR. The merchant pays more for growing.
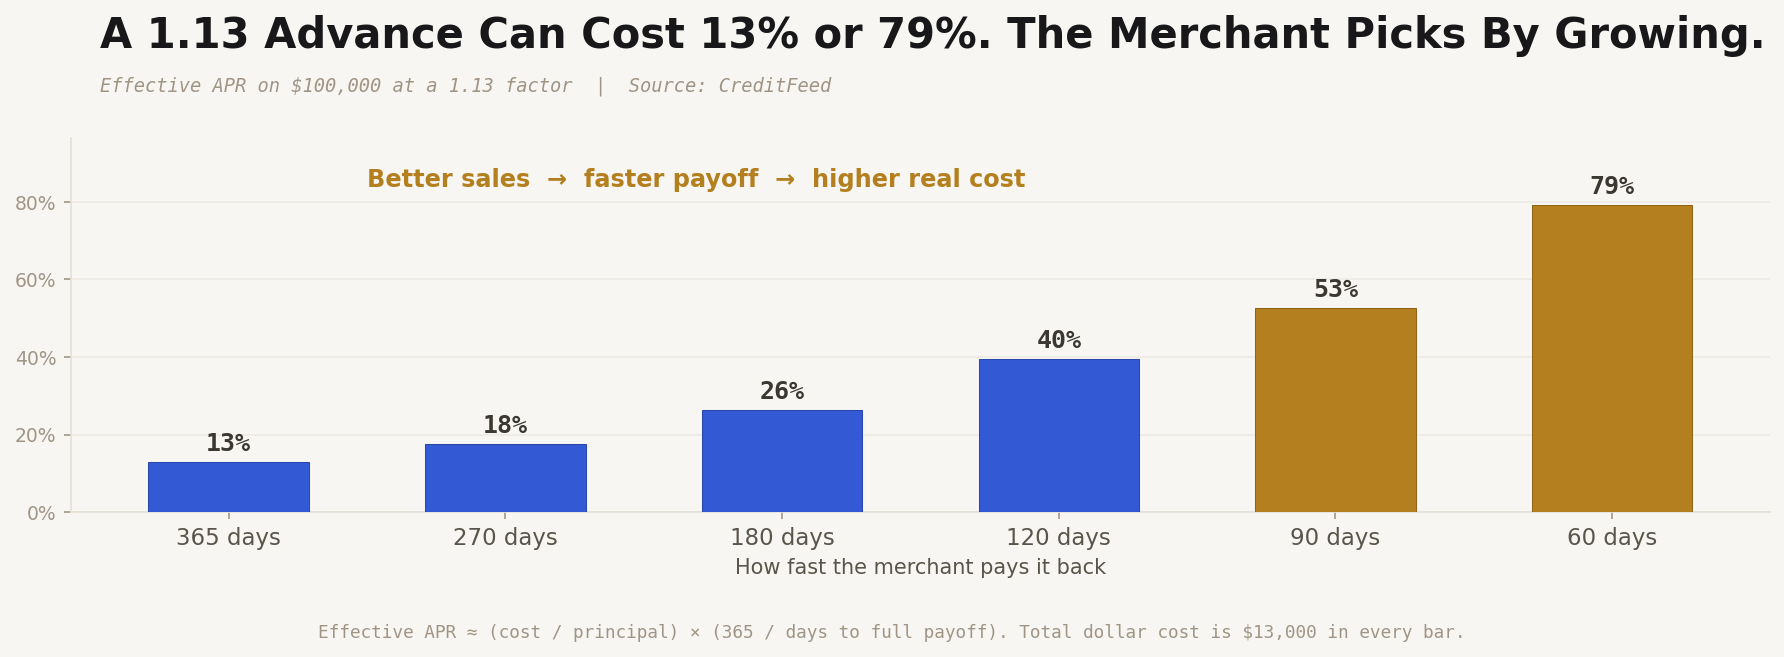
The same mechanic that protects him in a downturn works against him in a boom, and it is built into the product.
The disclosed cost is not wrong, it is just an estimate made at origination against a projected payoff speed. Beat that projection and the realized rate lands above the number the merchant agreed to. Nothing in the dashboard updates to tell him.
Monday: a fast-growing merchant on a platform advance has a specific, explainable reason to take a broker's call. Almost no broker is making this argument.
It cannot make an exception
Amount, factor rate, and holdback are set by the model. There is no counter and no structuring conversation. When the algorithm declines, for a chargeback uptick or one soft month, there is no human to appeal to and no explanation of what went wrong.
- •No reason given
- •No human to call
- •No counter-offer
- •No resubmission path
- •Wait and hope the model changes its mind
- •Re-package the file
- •Explain the seasonal dip in writing
- •Re-shop across desks with different appetites
- •Restructure the amount or the term
- •Syndicate it across multiple funders
A broker can re-package a file, explain a seasonal dip, shop it across desks with different appetites, and build a structure. That work does not automate, which is why platforms do not do it.
Monday: every algorithmic decline is a merchant who just tried to get capital, got told no by a machine, and has nowhere to go.
It cannot see a merchant it did not fund
At roughly 60% to 65% paydown, the platform automatically drops a renewal offer in the dashboard. Nobody remembers, nobody calls, it just fires.
But that only works for its own book. Square knows everything about Square merchants and nothing about anyone else's.
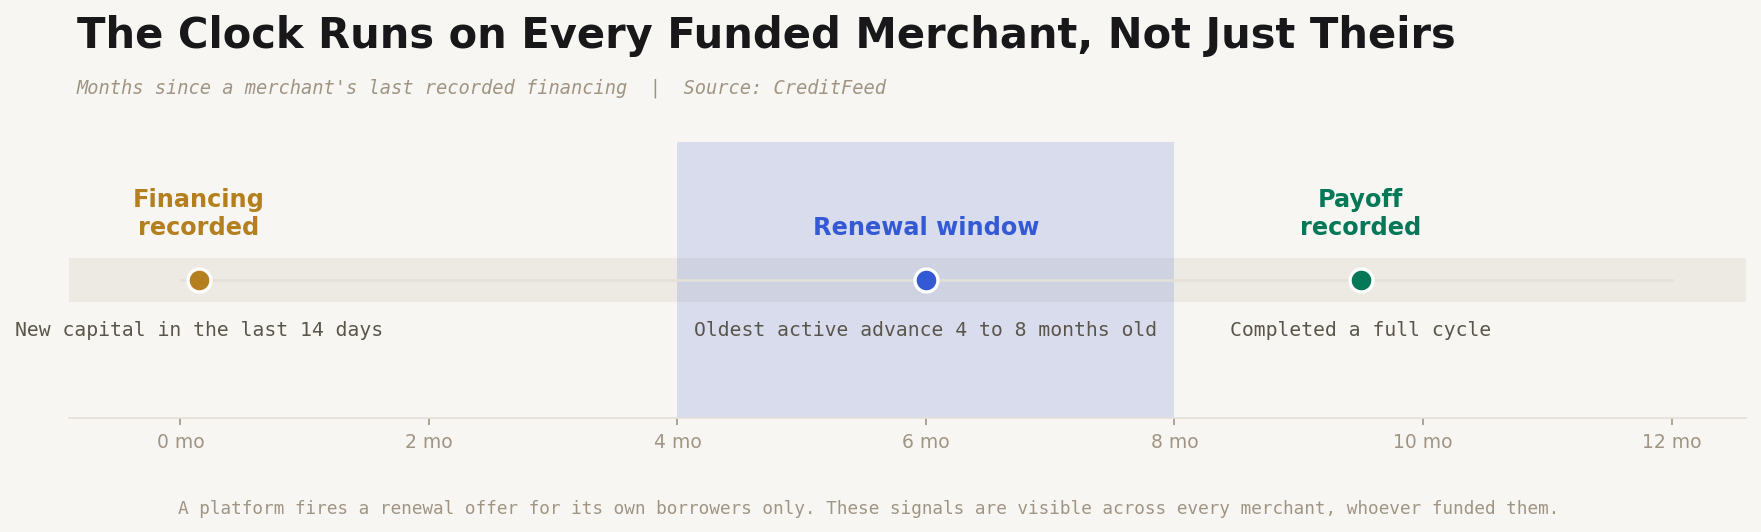
Funded merchants average around 1.5 financings a year in our data. That clock runs on every merchant in the market, and the public financing record hears it across all of them: oldest active advance 4 to 8 months old means renewal window, a recent payoff means a completed cycle, new capital in the last two weeks means the situation just changed.
Monday: no broker beats a pre-approved dashboard offer on speed. Timing is winnable, because there is no offer sitting there yet.
The six merchants a platform cannot fund
- Platform-blind verticals. Construction, professional services, trucking, healthcare, manufacturing. Half the market.
- Multi-channel merchants, under-offered. Sized on one slice of their revenue.
- Merchants who need more than the cap. Best qualified of the six. Syndication is a broker tool, not a platform one.
- Fast-growing merchants. Paying a rising real rate for the privilege of a good quarter.
- Algorithmic declines. High intent, no appeal, and a human can still fund them.
- Merchants in a renewal window nobody is watching. The platform only runs that clock for its own borrowers.
Every one is a state a specific business is in on a specific date, with a signature in the financing record: industry, last financing date, lender count, age of the oldest active position, recent payoff, platform lender on file.
A lead list confirms a business exists. It does not identify which of these six states that business is in this week. The state is the entire deal.
Part 3
Part 3 turns each of those six into a targeting definition and a working motion: which signals find the merchant, what the call actually says, and how ISOs and brokers can sequence a book so renewal windows get worked on time instead of six months late.
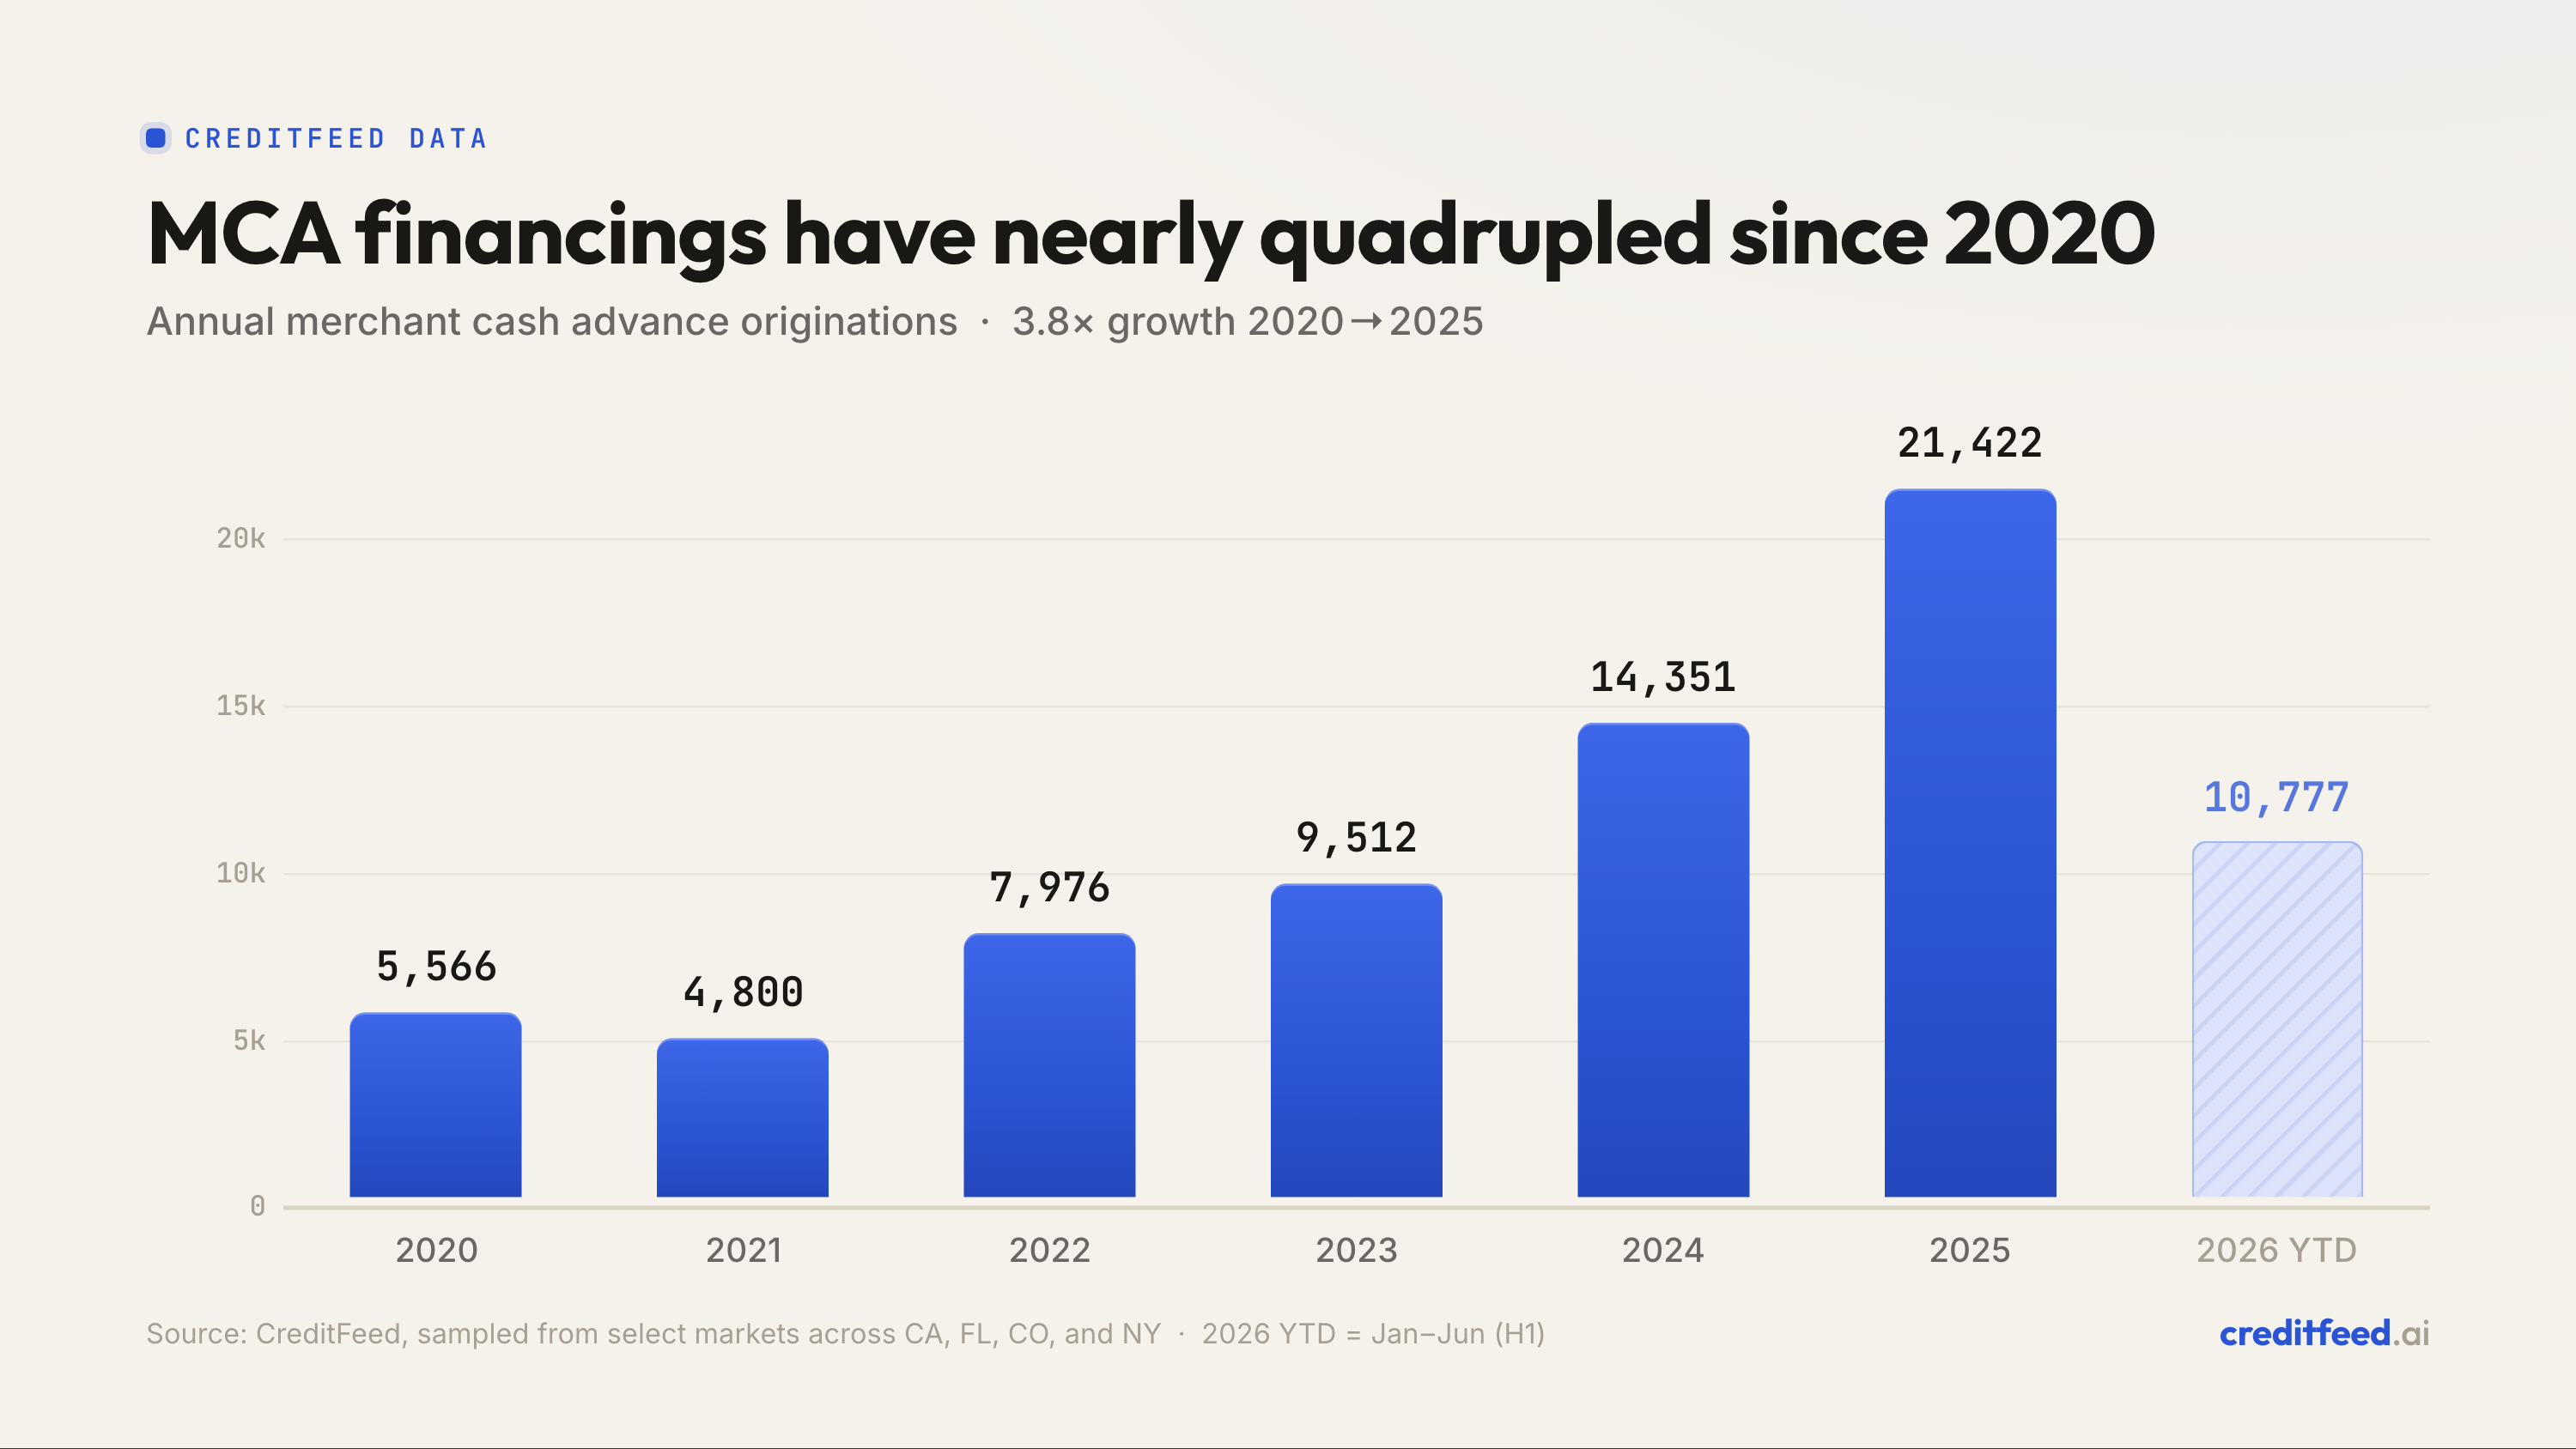
U.S. MCA origination roughly doubled between 2021 and 2025. The half platforms cannot take is bigger than the whole market was when they started taking it.
Program terms and pricing mechanics come from public company disclosures and published industry research. Industry mix and stacking figures come from CreditFeed's analysis of the public business financing record, sampled across the markets we cover. A longer reference version of this comparison is available on request. Nothing here is legal advice.