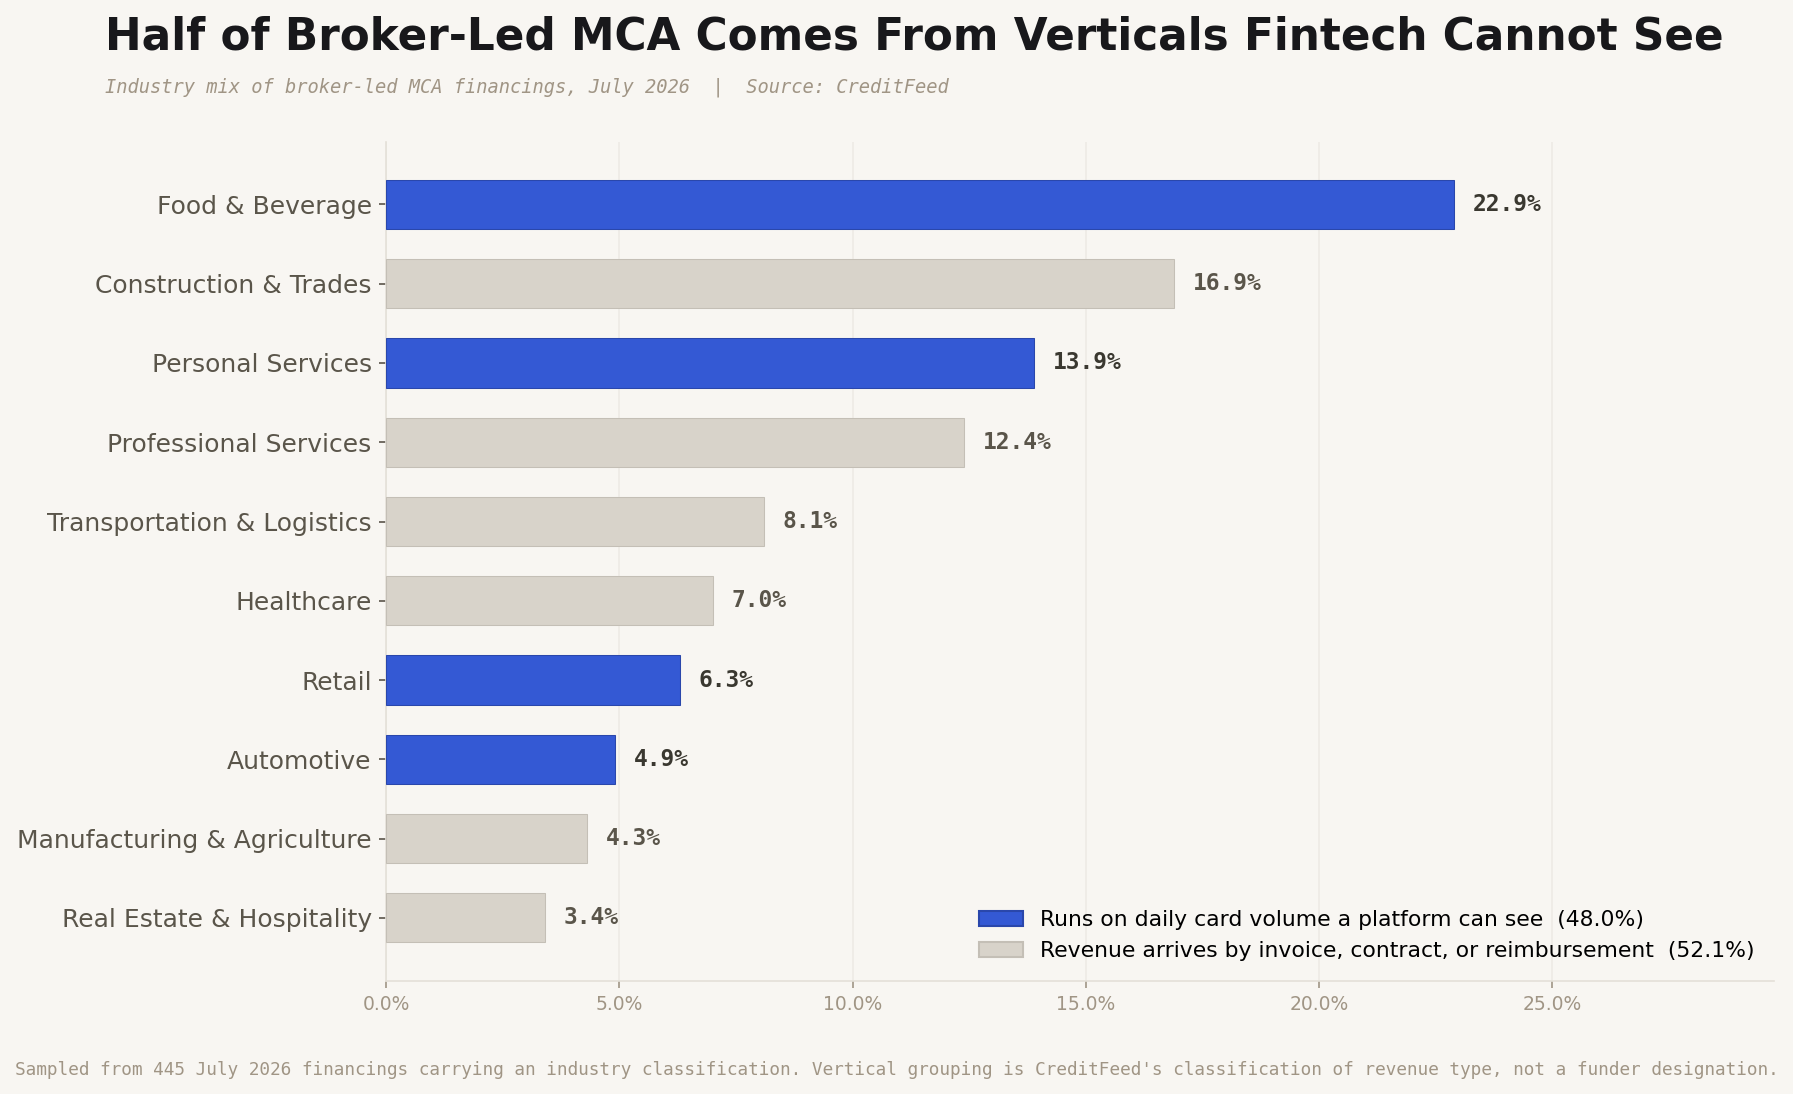
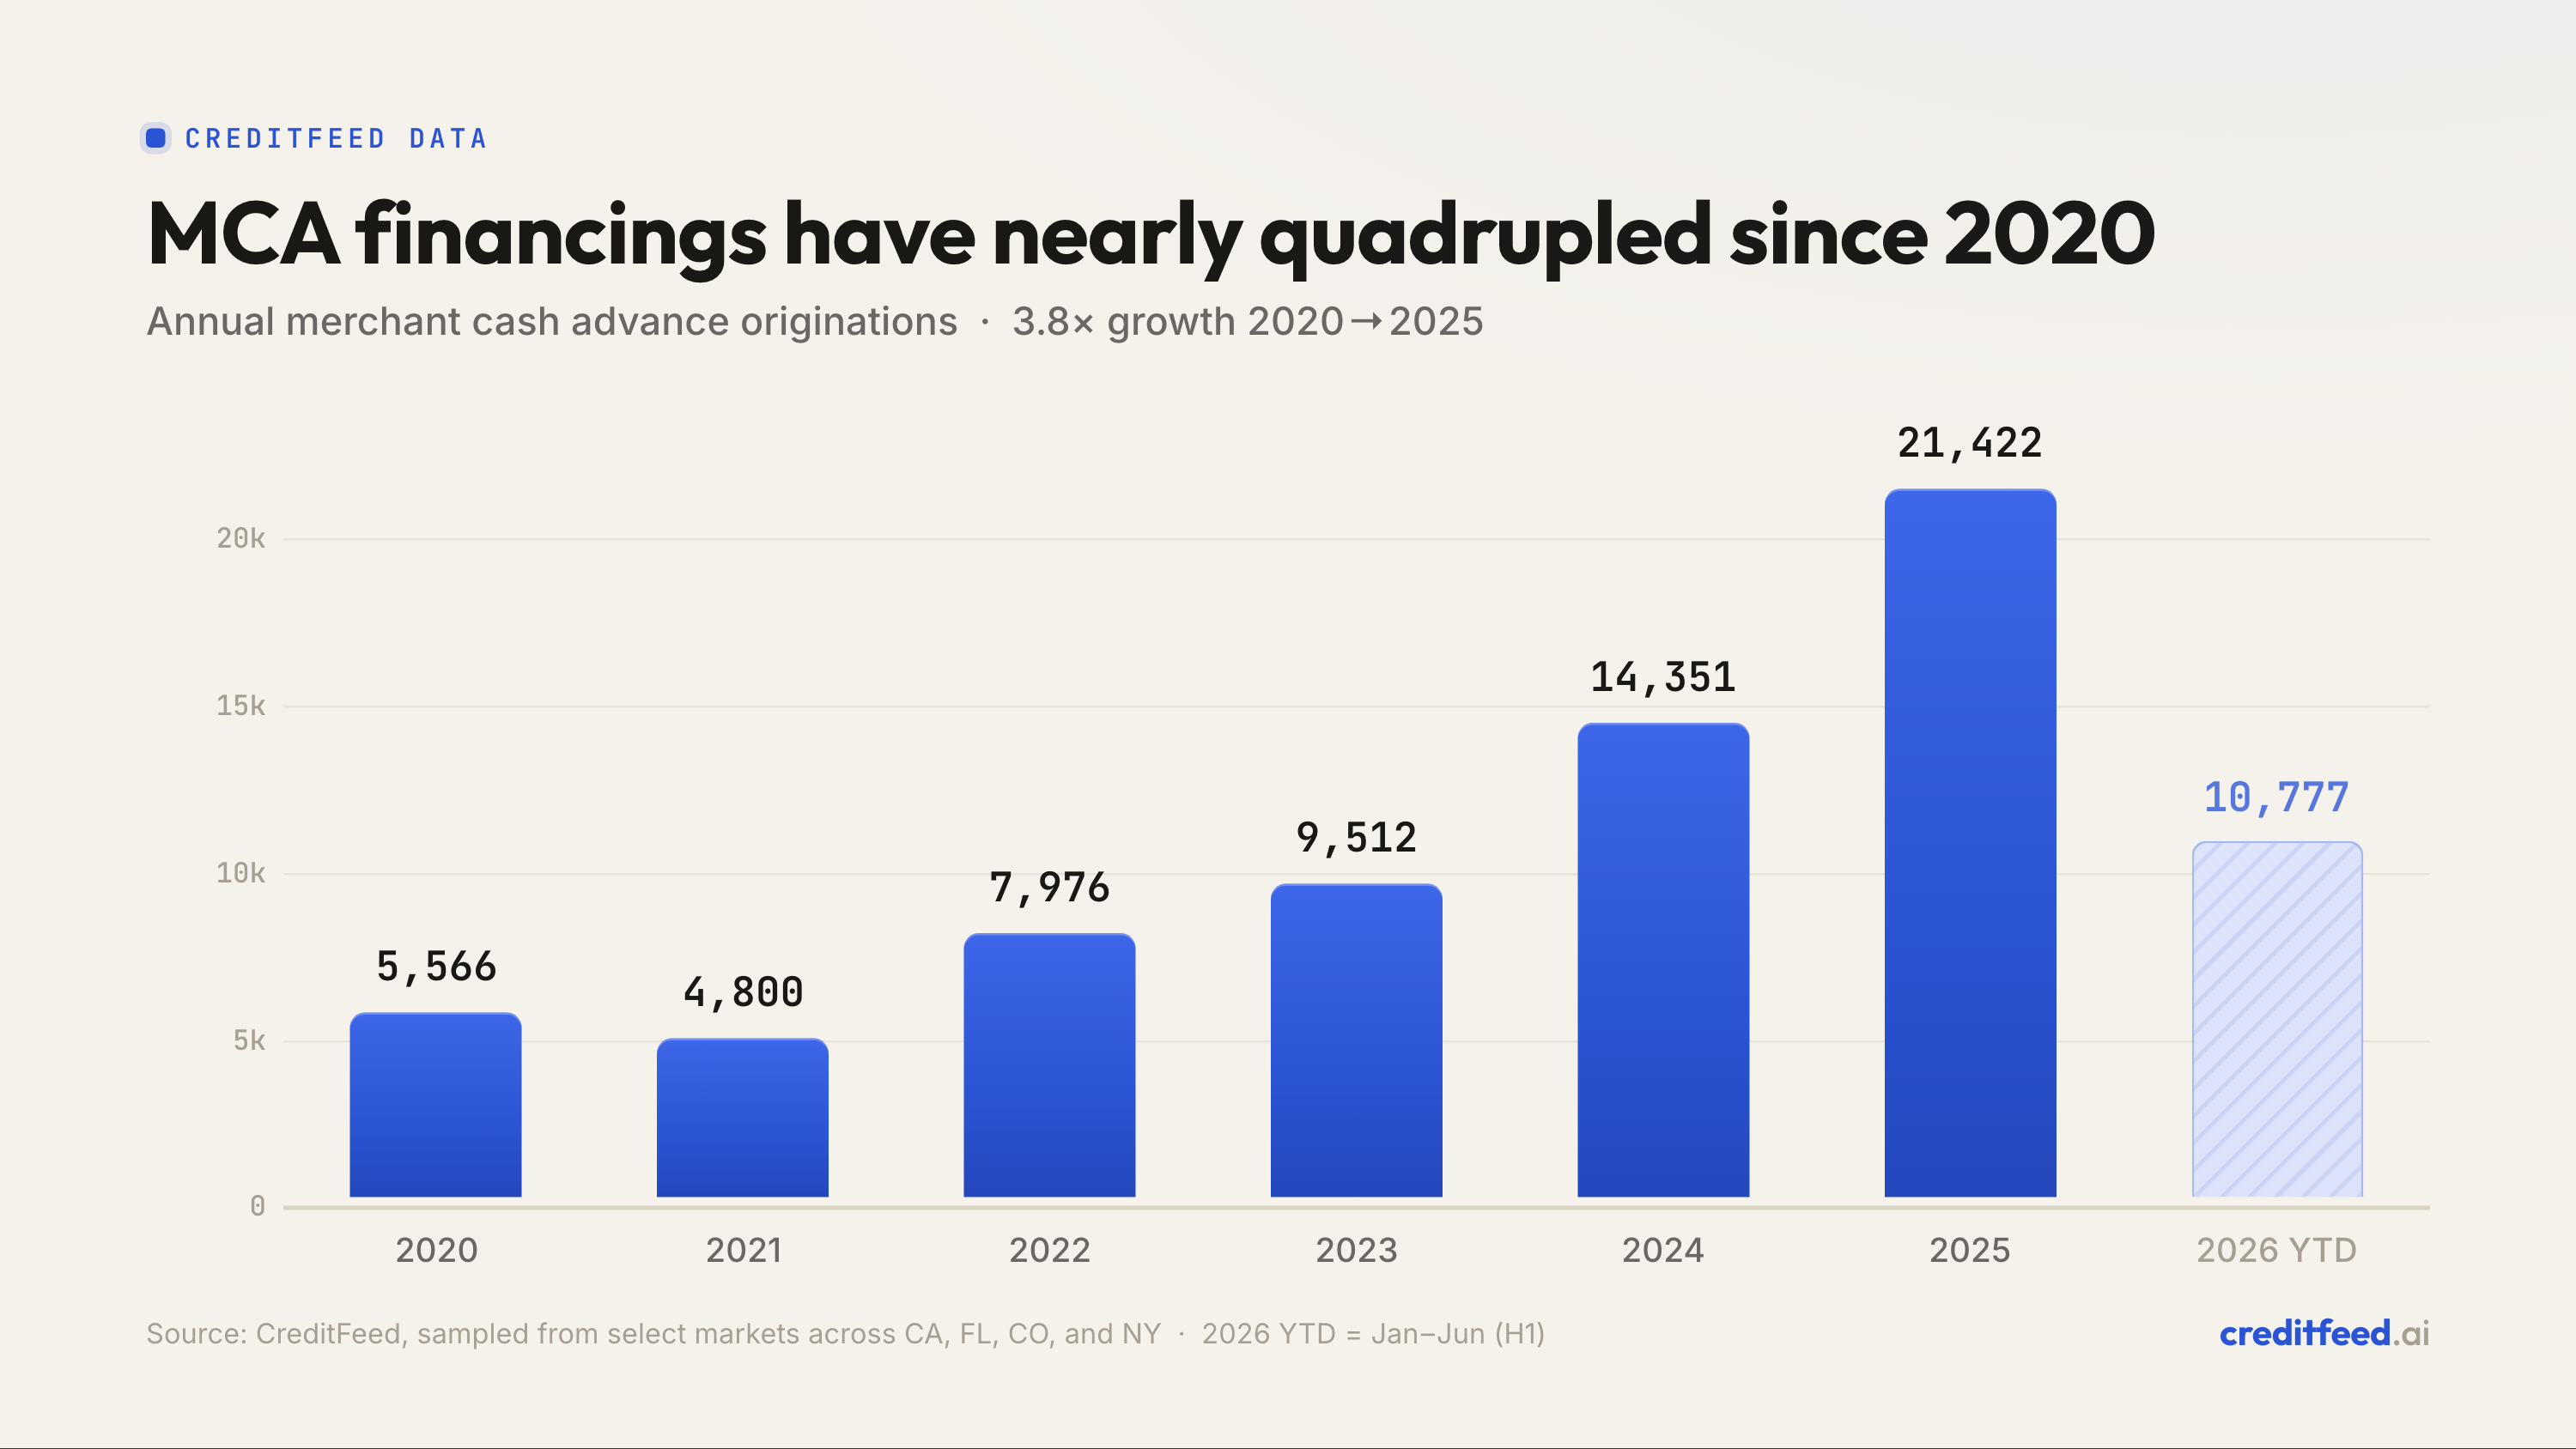
Food & Beverage Hit 22.9% of MCA Financings in July. Professional Services Halved.
We compared the industry mix of July 2026 MCA financings against June. Three verticals moved for real. Seven others looked like they moved and did not.
Someone shows you a chart. Construction is up five points month over month. You start reworking your prospecting list around contractors.
The move was not real. At the sample size behind that chart, a five point swing in construction is what randomness looks like.
This is the problem with monthly industry breakdowns in MCA. They all look decisive. Most of them are not. So when we compared the July 2026 industry mix against June, we ran every move through a significance test first and only kept what survived.
Three verticals moved. Seven did not.
Food & Beverage took nearly a quarter of the market
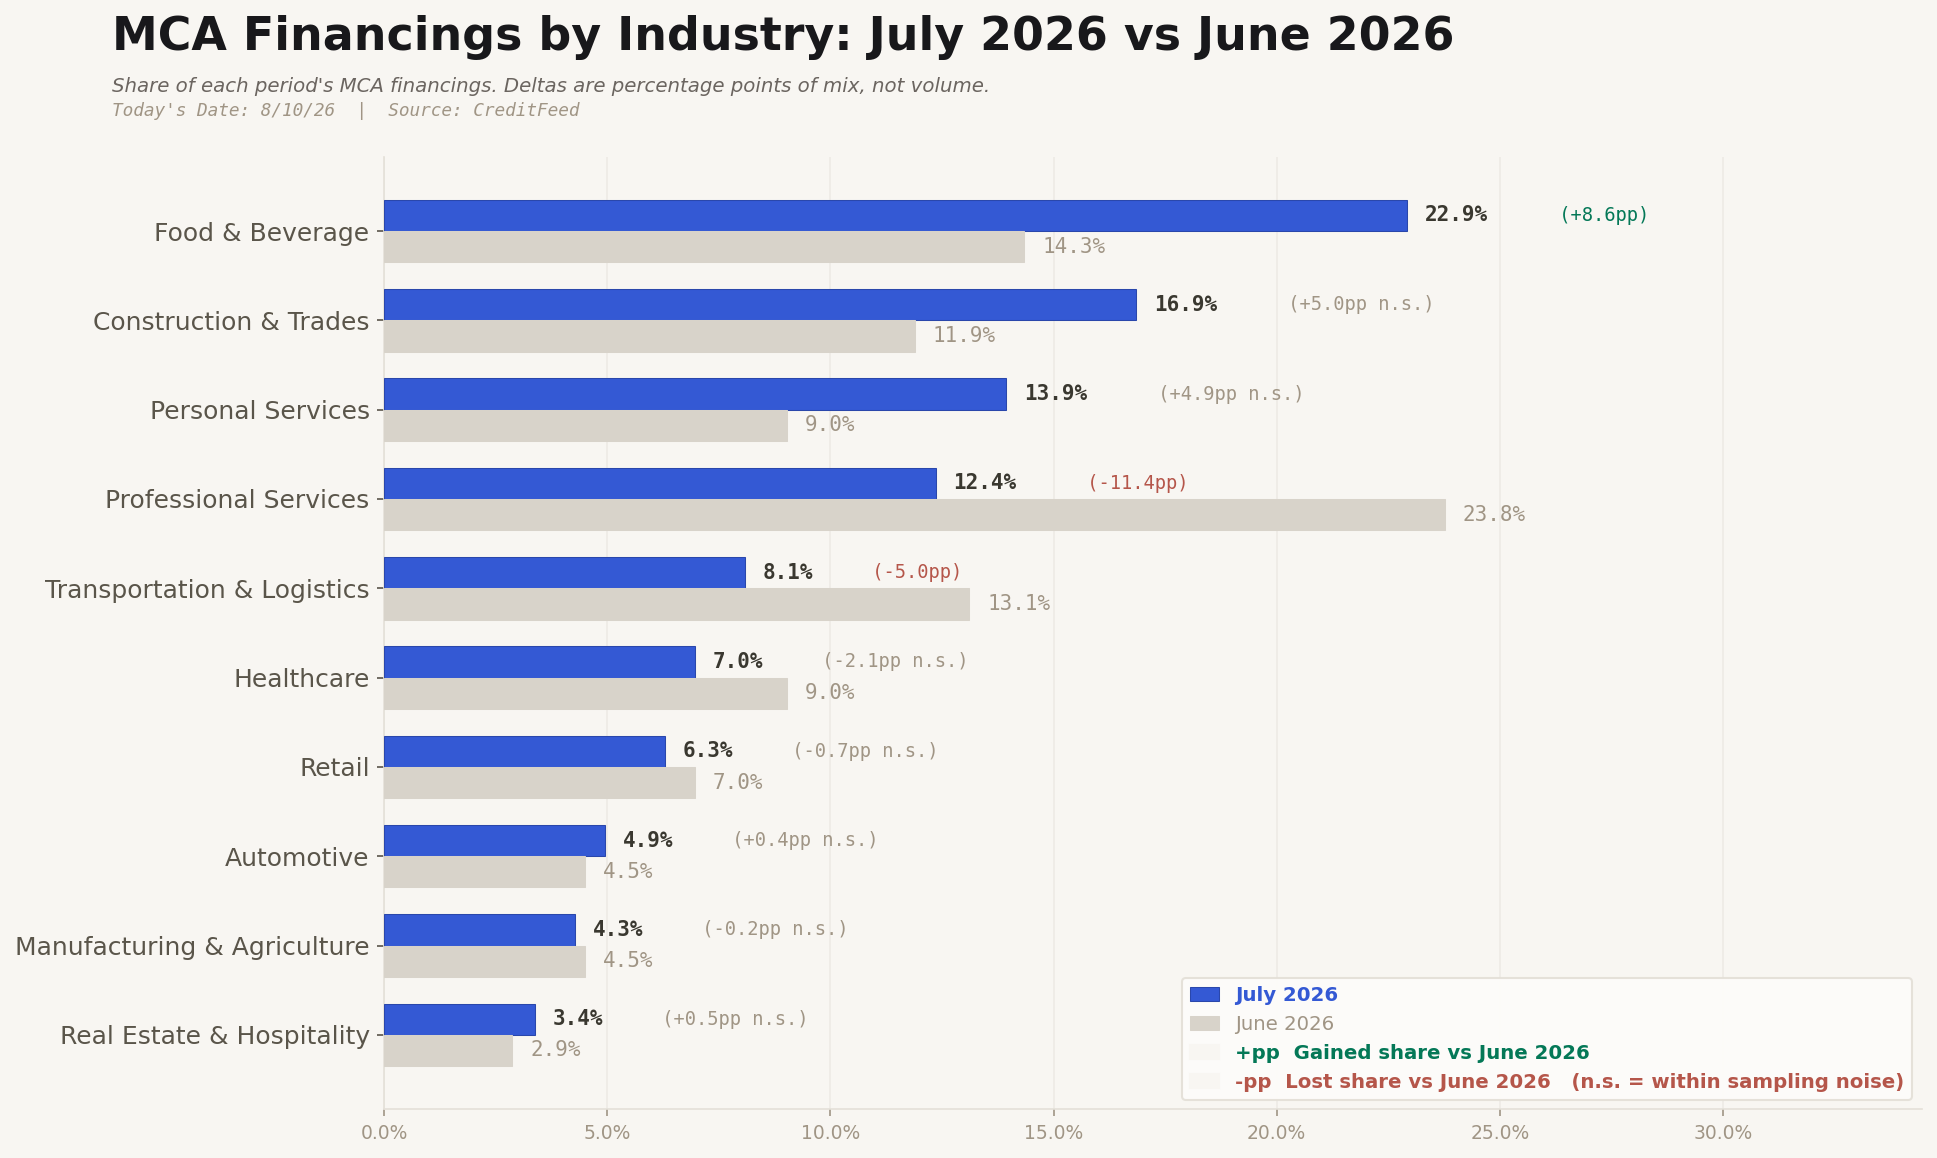
Food & Beverage went from 14.3% of MCA financings in June to 22.9% in July. That is an 8.6 point gain, and it is the largest real move in the data.
Restaurants, bars, cafes, and food service have always been a high-volume MCA vertical. In July they were close to a quarter of everything funded across the markets we sample.
Professional Services lost half its share
In June, Professional Services was the single largest vertical at 23.8%. In July it was 12.4%.
That is an 11.4 point drop, the biggest move in either direction, and it is the one worth understanding. Professional Services covers accounting practices, agencies, consultancies, law offices, and similar operations. These are businesses with invoice-driven revenue rather than daily card volume.
One month does not establish a trend. But going from the largest vertical to the fourth largest in a single month is not a rounding error either.
Transportation & Logistics kept sliding
Trucking and logistics went from 13.1% to 8.1%, a 5.0 point decline.
This one is worth watching rather than reacting to. Trucking has been the vertical most exposed to fuel costs and freight rate swings, and it is heavily concentrated among funders who specialize in it. A drop in its share of total financings can mean fewer trucking deals getting done, or it can mean the same trucking deals moving to funders who show up differently in the data.
What did not move
This is the part most monthly breakdowns skip.
| Industry | June | July | Change |
|---|---|---|---|
| Construction & Trades | 11.9% | 16.9% | +5.0 points |
| Personal Services | 9.0% | 13.9% | +4.9 points |
| Healthcare | 9.0% | 7.0% | -2.1 points |
| Retail | 7.0% | 6.3% | -0.7 points |
| Automotive | 4.5% | 4.9% | +0.4 points |
| Manufacturing & Agriculture | 4.5% | 4.3% | -0.2 points |
| Real Estate & Hospitality | 2.9% | 3.4% | +0.5 points |
Construction gaining five points and Personal Services gaining nearly five look like the second and third biggest stories in the data. Neither clears a significance test at this sample size. Run the same measurement again on a different random sample of the same market and those numbers could easily land the other way.
Flat is a finding. Construction holding steady through a month when Professional Services collapsed tells you something. It just does not tell you that construction is surging.
How this was measured
Across the markets we sample, we identified MCA originations recorded in July 2026 and June 2026, then matched each funded business to an industry classification and compared the two months on share of total.
Every month-over-month change was run through a two-proportion z-test at 95% confidence. Three moves cleared it. The seven in the table above did not, and they are marked on the chart so nobody reads them as trends.
Each industry was tested on its own, without a correction for running ten tests at once. That correction would be stricter, and the narrowest of the three surviving moves is the one most likely to soften under it or on a re-run. Food & Beverage and Professional Services are the two that hold up under either standard.
Three limits worth stating plainly. First, the mix is measured on classified financings rather than every financing in the market, so it is a sample and not a census. Second, recent months fill in over time as records are recorded and processed, and July is still filling in. Third, coverage is not evenly spread across states, and the state mix of what we measured shifted between June and July. Some of the movement above is that shift rather than merchant behavior. Treat these numbers as directional signal about where funded volume is concentrating, not as a settled account of the month.
We would rather publish the caveat than publish a clean number that does not hold up.
What brokers should do with this
If you are allocating prospecting effort by vertical, the three real moves are the ones to act on.
Food & Beverage is where funded volume concentrated in July. More merchants in that vertical closed on capital last month than in any other, which means more of them are now inside a payback window and more of them have a recent, provable financing history.
Professional Services deserves attention for the opposite reason. A vertical that halves its share in a month is either cooling or repricing. If you carry a book of accounting and agency clients, the more useful question this month is which of them already took capital and when, rather than how many new ones you can find.
And be skeptical of the next monthly industry chart you see, including ours. Ask whether anyone tested the movement or just plotted it. Most of the month-over-month swings in this market are noise wearing a trend's clothing. Sorting the three that matter from the seven that do not is the entire job.
Data from CreditFeed. Explore the data yourself at creditfeed.ai